Cold Spring Harbor Laboratory, P. O. Box 100, 1 Bungtown Road, Cold Spring Harbor, NY 11724, U. S. A.; mzhang@cshl.org
Keywords: promoter, database, yeast, genes, regulatory regions, transcription factors, analysis tools
1. Introduction
About 6000 opening reading frames have been annotated in the genome of Saccharomyces cerevisiae. Among these, about 3000 genes have been identified and studied by various means. In most cases, the gene expression is regulated by upstream regulatory elements, which are the binding sites of transcriptional factors. Roughly 150 genes code for transcriptional factors. Some of them have been shown to bind to specific sites on DNA, either activate or repress transcription via contact with basal transcription machinery. Some factors are universal which control the basal level of transcription. Others are specific to a group of coregulated genes or response to specific signals.
Efforts have been made to construct databases containing the information of promoter regions EPD (1), transcriptional factors, TRANSFAC(2) and TFD(3), and transcriptional regulatory regions, TRRD(2). Here we present an integrated promoter database of the yeast Saccharomyces cerevisiae (SCPD). This database is aimed at providing standardized information of existing knowledge as well as tools to help researcher to find new regulatory elements in gene expression. It also provides a repository for bench biologist to add or to update the database information.
2. Genes with mapped regulatory regions
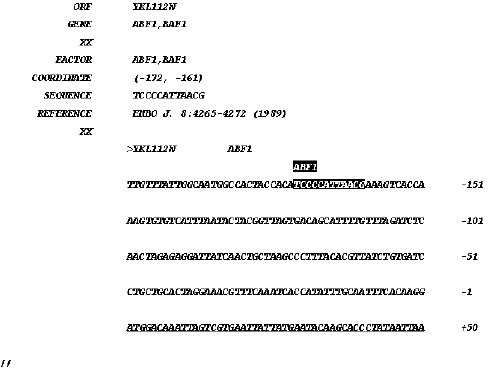
Figure 1 shows a gene record in SCPD. Each gene is identified by a unique ëORFí id as defined in SGD and GENBANK. Alternative ëGENEí names are included. ëFACTORí denotes names of transcrptional factors or regulators. Alternative names are also allowed. The ëCOORDINATEí of a binding site or regulatory element is presented as the distance from the start codon of the ORF (ATG, with ëAí at +1).
The records in SCPD were collected from TRANSFAC, TFD and published literature. They were processed as follows. The upstream region of each gene is pulled out from the genome sequence provided by SGD. The documented sites are located in the upstream region. Their coordinates may differ from those in TRANSFAC or original literature where reference points other than ëATGí may be applied. Any discrepancies between SGD sequences and the published ones are resolved by adjusting to SGD. Currently, SCPD contains 160 genes with 450 entries of regulated elements.

Figure 1. A gene record in SCPD. The ORF region is underlined.
3. Regulatory regions and transcriptional factors
For each regulatory region and transcriptional factor, SCPD provides the following information.
1) Regulated genes. Clicking on a gene name will bring up a record as shown above.
2) Consensus sequences. Two types of consensus sequences are defined. An exact consensus represents the most conserved sequence while degenerate consensus incorporates all possible known variations. Two rules are provided for locating a putative consensus sequence: the maximal difference allowed between exact and degenerate consensus and the distribution range retative to ëATGí.
3) Matrix. The matrices are constructed only for those with enough number of mapped sites. The cutoff value of each matrix is determined from the existing data set.
4) Binding affinity and expression efficiency. This includes information on binding affinity and influence of sequence variations on gene expression.
5) Genome-wise distribution. This will display the putative sites on each chromosome. It is done by searching the consensus sequences through each chromosome with or without additional rules.
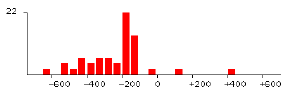
6) Distribution in all promoter regions. Comparative promoter regions (-700 to +700 relative to ATG) of all identified genes (2921 orfs) are extracted from SGD. The distribution of each element using its exact consensus is obtained. General transcriptional factors such as TBP (TATAAA) have biased distribution in the upstream region as shown in FIGURE 2. Its optimal location is about 150 base pairs from ATG. Another common element poly(A/T) has similar biased distribution as well.
7) Distribution in promoter regions of regulated genes. This is based on experimental mapped sites. In most cases biased distribution is observed. An example is shown in FIGURE 3. This information will be used to identify novel elements in uncharacterized regions. In case that multiple candidates are found, the most probable one can be determined based on the positioning information. For example, if more than one TATA-boxes are identified, the one located around position ñ150 is most likely to be the real one. We have developed a program called TATA-locator using the above approach.
8) Distribution in promoter regions of function related groups. Regulatory elements related to specific function show strong biased distribution in the upstream region of corresponding function group. For example, GCN4 (TGACTC) in amino acid synthesis related genes and MCB (ACGCGT) in cell-cycle related genes (FIGURE 3). It is worth mentioning that GCN4 doesnít show biased distribution in all promoter regions (2921 genes) while MCB does. It indicates MCB is a more general transcriptional factor.
 |
 |
| FIGURE 2. Distribution of TATAAA in all promoter regions(2921 genes). Start codon ëATGí is 0. | FIGURE 3. Distribution of ACGCGT in cell cycle-related genes (47 genes expressed in G1/S). |
4. Correlation between regulatory elements
Some regulatory elements have multiple copies in the upstream region. Different types of elements may be closely located. A study on repetitive regulatory elements showed the optimal distance between two repeated elements is around 20 bp. This serves as a criterion for distinguishing repetitive sequences with regulatory functions from those having no roles in regulation.
5. Analysis Tools
The following tools are provided to facilitate the analysis of promoter regions. And more will be added in the future.
1) Retrieve promoter sequences. User can retrieve promoter sequences by providing ORF id or gene names with defined coordinates. Multiple sequences in FASTA format can be pulled out.
2) Searching via consensus sequences and matrices. The program allows user to use predefined consensus patterns and matrices to search multiple sequences, displays the information of putative sites in each sequence and summarizes some statistical features such as overall distribution, average copies per sequence, distribution of distances of repetitive elements etc. User defined consensus pattern and matrix are allowed. It can construct a matrix or consensus pattern using the output generated from multiple sequence alignment programs such as Consensus(4), Gibbs sampler(5) and MEME(6). In addition, we are also developing a DNA specific Gibbs sampler that can accommodate various structural or symmetry constraints.
3) Microarray dataviewer. Microarray (DNA chips) has become a major technique in studying genome-wise gene expression (7). The Java based microarray dataviewer can extract useful information, sort out gene clusters following similar expression patterns. The promoter regions of genes in each cluster are pulled out and used as input for multiple sequence alignment programs (Consensus, Gibbs and MEME). The alignment results are processed by checking each identified pattern of their distributions in upstream and down stream of the start codon. This program can be used as a standalone application instead of an applet running on the web.
4) Repetitive sequence mapper. This is a Java program used to identify repeated elements in multiple sequences. The statistics for each identified repeat will be provided. A recommendation of whether shared elements play a role in regulation will be provided.
Acknowledgement
This work is supported by a NIH grant 1R01 HG01696 and a CSHL Association Award to MQZ.
Reference
- R. Cavin Perier, T. Junier, P. Bucher, ìThe Eukaryotic Promoter Database EPDì Nucleic Acids Res 26, 353 (1998).
- T. Heinemeyer, E. Wingender, I. Reuter, H. Hermjakob, A. E. Kel, O. V. Kel, E.V. Ignatieva, E.A. Ananko, O.A. Podkolodnaya, F.A. Kolpakov, N.L. Podkolodny, N.A. Kolchanov. ìDatabases on transcriptional regulation: TRANSFAC, TRRD and COMPELî Nucleic Acids Res. 26, 362 (1998).
- D. Ghosh, ìTFD: the transcription factors databaseî Nucleic Acids Res. 20, 2091 (1992).
- G.Z. Hertz, G.W. Hartzell, G.D. Stormo, ìIdentification of consensus patterns in unaligned DNA sequences known to be functionally relatedî Comput Appl Biosci 6, 81 (1990).
- C.E. Lawrence, S.F. Altschul, M.S. Boguski, J.S. Liu, A.F. Neuwald, J.C. Wootton, ìDetecting subtle sequence signals: a Gibbs sampling strategy for multiple alignmentî. Science, 262, 208 (1993).
- T.L. Bailey, M. Gribskov, ìCombining evident using p-value: application to sequence homology searchesî, Bioinformatics, 13, 6 (1997).
- J.L. DeRisi, V.R. Iyer, P.O. Brown, ìExploring the metabolic and genetic control of gene expression on a genomic scaleî Science 278, 680 (1997).
