PONOMARENKO J.V.+, FURMAN D.P., MISHCHENKO T.M., KATOKHINA L.V., VALUEV V.P., PEREGOEDOVA E.L., FROLOV A.S., PODKOLODNY N.L.1, PONOMARENKO M.P.
Institute of Cytology and Genetics, (Siberian Branch of the Russian Academy of Sciences), 10 Lavrentieva ave., Novosibirsk, 630090 Russia
1Institute of Computational Mathematics & Mathematical Geophysics, Novosibirsk, 630090 Russia;
+Corresponding author: IC&G, Novosibirsk, 630090 Russia; FAX: +7(3832)356-558; e-mail: jpon@bionet.nsc.ru
Keywords: activity, database, DNA/RNA, functional sites, promoters, protein-binding sites, mRNA leaders, pre-mRNA processing sites, equilibrium constants, SRS
Molecular genetic processes occurring in the cell, such as replication, transcription, splicing. translation, etc., are under the control of functional sites with definite specific activities. Primary sequences, location in DNA or RNA, and the values of specific activities under various conditions have been experimentally determined for thousands of actual variants of such sites. These experimental data demonstrate that the sites of the same type located in different DNA (RNA) regions of pro- and eukaryotic genomes can differ in the values of their specific activity by several orders of magnitude. This difference was observed in naturally occurring functional sites as well as in their mutational or synthetic analogues.
Investigation of those peculiarities of functional sites that determine the level of their activity is of ever increasing importance, first and foremost, due to the fact that differences in the site activity levels are the basis for differential activity of the genes and their coordinated function in pro- and eukaryotic organisms. The computer system ACTIVITY [1] was developed for this particular goal; the database ACTIVITY for the functional DNA/RNA site activities is one of the components of this system. The ACTIVITY is WWW-accessible at URL http://wwwmgs.bionet.nsc.ru/systems/Activity/.
The database ACTIVITY contains currently descriptions of 451 experiments from 221 published papers. One entry describes one experiment. ACTIVITY contains experiments on promoters, protein-binding sites, mRNA leaders, pre-mRNA processing sites, and many other DNA and RNA sites of pro- and eukaryotic genomes (Table 1).
Examples of the data on activities of eukaryotic transcription factor binding sites are shown in Table 2. For instance, transcription activity, lifetime of TBP-TATA complex, and DNA bending induced by TBP for various mutant TATA boxes within the context of the adenovirus major late promoter have been measured [2]. Determined also are the affinity of human TFIID for human and viral TATA boxes [3], affinity of yeast TBP for synthetic oligo-ssDNA [4], transcription activity of various mouse IIb MyHC promoter constructs (TATA-box mutants) in quail myotubes and cotransfected mouse C2 myotubes [5] etc.
An activity is characterized quantitatively in terms of kinetic and equilibrium constants, lifetime, and helical bend of DNA/protein complexes, cutting efficiencies, the reporter gene expression, transcription or translation levels, etc. As is evident from Table 2, different site variants can differ if the level of their activity. For example, DNA bending angle induced by TBP protein in various mutant TBP/TATA-box complexes varies from 33° to 106° and lifetime of these TBP/TATA-box complexes varies from 1 to 185 min [2]; natural TATA boxes differ in their affinity for the factor hTFIID 20-fold [3]; mutant Inr elements within the context of the SV40 ML promoter differ in the dissociation rate constant more than 600-fold in the in vitro experiments and more than 300-fold in the in vivo experiments [6].
Table 1. Content of the ACTIVITY entries.
|
site type |
taxon |
number of entries |
|
| 1 | DNA transcription factor binding sites |
EUKARYOTA |
323 |
| 2 | Other DNA sites |
EUKARYOTA |
24 |
| 3 | RNA sites |
EUKARYOTA |
52 |
| 4 | DNA sites |
PROKARYOTA |
38 |
| 5 | RNA sites |
PROKARYOTA |
14 |
Table 2. Examples of data on eukaryotic transcription factor binding sites in database ACTIVITY.
| site (FF) | genome region (OS) | protein | type of activity (AN) | activity unit (AU) |
min |
max |
num |
ref |
| TATA box | Ad ML promoter | TBP | transcription activity | ln |
-2.2 |
0.0 |
8 |
2 |
| TATA box | Ad ML promoter | TBP | lifetime of the TBP/TATA-complex | minute |
1 |
185 |
8 |
2 |
| TATA box | Ad ML promoter | TBP | DNA bending | degrees |
33 |
106 |
8 |
2 |
| TATA box | human and its viruses genome | hTFIID | affinity | -ln[KD] |
-3.0 |
0.0 |
8 |
3 |
| TATA box | synthetic oligo-ssDNA | yeast TBP | affinity | -ln[KD] |
11.78 |
24.23 |
19 |
4 |
| TATA-box | mouse MyHC gene | TATA-b.p. | transcription activity in co-transfected mouse C2 myotubes | percent |
26 |
100 |
8 |
5 |
| TATA-box | mouse MyHC gene | TATA-b.p. | transcription activity in quail myotubes | percent |
4 |
112 |
14 |
5 |
| Inr | SV40 ML promoter | Inr-b.p. | affinity in vitro | -ln[KD/KD(WT)] |
-4.61 |
1.95 |
28 |
6 |
| Inr | SV40 ML promoter | Inr-b.p. | affinity in vivo | -ln[KD/KD(WT)] |
-4.61 |
1.25 |
28 |
6 |
| Inr | mouse MHC II Ea gene | TFIID+TAFs | affinity | percent |
13 |
100 |
10 |
7 |
| Inr | mouse MHC II Ea gene | TFIID+TAFs+
TFIIA |
affinity | percent |
29 |
105 |
10 |
7 |
| HNF1 b.s. | different vertebrate genes | HNF1 | transcription activity | rank scale |
1 |
5 |
55 |
8 |
| Ets-related b.s. | human T-, B-cell specific genes | NERF-1a | affinity | rank scale |
0 |
4 |
26 |
9 |
| Oct-sequences | synthetic oligonucleotides | Oct-2B mouse | affinity | Kd, e-9M |
4.5 |
28.2 |
15 |
10 |
| GATA b.s. | C.elegans elt-1 gene (-229/-246) | ELT-1 | transactivation by Elt-1 | units |
0.1 |
25.3 |
20 |
11 |
| YY1 b.s. | natural and synthetic oligonucleotides | YY1 | affinity | percent |
0 |
100 |
8 |
12 |
| YY1 b.s. | YY1 b.s. upstream of a minimal promoter (-70/-80) | YY1 | transcription activity in HeLa cells | percent |
0 |
97 |
13 |
12 |
| gERE | human gastrin promoter | EGF | basal actiivity | percent |
1 |
160 |
10 |
13 |
| gERE | human gastrin promoter | EGF | induction by EGF | units |
0.3 |
4.5 |
10 |
13 |
| gERE – gastrin EGF response element; EGF epidermal growth factor; Ad ML – Adenovirus Major late; b.s. – binding site; b.p. – binding protein; min, max – minimal and maximal values of activity for site variants; num – number of site variants. |
Format
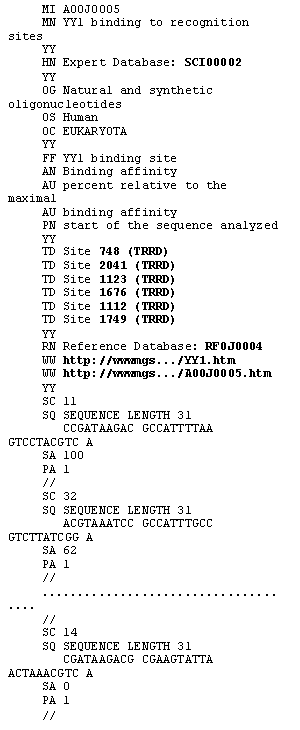
ACTIVITY database is distributed and maintained as a single ASCII flatfile. The format of ACTIVITY is compatible with SRS [14] for automatic processing of data retrieval queries. Each line starts with a line code, identifying the type of information presented. An example of an ACTIVITY entry is shown in Figure 1. The entry contains variants of natural and synthetic transcription factor YY1 binding sites and the values of binding affinity (%) relative to the maximal binding affinity [12], measured for each site variant. The MI line contains a unique entry identifier, the MN line contains the entry name. The OG, OS, and OC lines indicate the name of the gene or genomic region, the species and taxon of the organism, and DNA/RNA sequence used in experiment, respectively. The FF line contains the site name. The AN and AU lines contain the type of activity and measurement unit information. The PN line gives the name of phasing points (start of synthetic DNA, transcription start, etc.). The SC, SQ, SA, and PA lines contain the name of site variant, its sequence, the value of activity, and the position of point from the PN line relative to site start, respectively. The HN and RN lines indicate cross-references to SCIENTIST and REFERENCE databases of the computer system ACTIVITY. The TD line contains cross-references to TRRD database. The WW lines contain cross-reference to the image of X-ray structure of the corresponding DNA-protein complex (in this case, YY1-DNA complex) and the image of the corresponding figure with activity data scanned from the paper, if these activity data are not numerical. The image for the entry considered is shown in Figure 2.
Figure 2. YY1 binding to representative recognition sites (scanned from [12]).

The database ACTIVITY of experimental data on activities of DNA and RNA functional sites provides the possibility of target large-scale studies of DNA (RNA) aimed to reveal those DNA (RNA) peculiarities that are responsible for the level of site activity and allows methods for activity prediction of sites from their sequences to be constructed. The prediction itself is performed by the computer system ACTIVITY, which is a component of the system GeneExpress developed for description, analysis, and recognition of regulatory sequences in the eukaryotic genome (http://wwwmgs.bionet.nsc.ru/Systems/GeneExpress/).
We are grateful to Ms Galina Chirikova for assistance in translation.
This work is supported by grants from the Russian Foundation for Basic Research (No.97-04-49740, 97-07-90309, 96-04-50006, 98-04-49479, 98-07-90126); Russian Ministry of Science and Technologies; Russian Human Genome Project; Russian Ministry of High Education; Siberian Department of RAS (Programms for support of reseach of young scientists and Programm of Integration projects); National Institutes of Health, U.S.A. (No.5-R01-RR-04026-08).
Reference
- Kolchanov N.A., Ponomarenko M.P., Ponomarenko Yu.V., Podkolodny N.L., Frolov A.S. 1998. Functional sites in the prokaryotic and eukaryotic genomes: Computer models and activity predictions. Mol. Biol (Msk). 32, issue N2 (in press.)
- Starr DB, Hoopes BC, Hawley DK. DNA bending is an important component of site-specific recognition by the TATA binding protein. J Mol Biol, 1995, 250, 434 446.
- Wiley S.R., Kraus R.J., Mertz J.E. Functional binding of the “TATA” box binding component of transcription factor TFIID to the -30 region of TATA-less promoters. Proc Natl Acad Sci U.S.A., 1992, 89, 5814 5818.
- Sokolenko AA, Sandomirskii II, Savinkova LK Interaction of yeast TATA-binding protein with short promotor segments. Mol Biol (Mosk), 1996, 30, 279 285.
- Diagana TT, North DL, Jabet C, Fiszman MY, Takeda S, Whalen RG The transcriptional activity of a muscle-specific promoter depends critically on the structure of the TATA element and its binding protein. J Mol Biol, 1997, 265, 480 493.
- Kraus RJ, Murray EE, Wiley SR, Zink NM, Loritz K, Gelembiuk GW, Mertz JE Experimentally determined weight matrix definitions of the initiator and TBP binding site elements of promoters. Nucleic Acids Res, 1996, 24, 1531 1539.
- Bellorini M, Dantonel JC, Yoon JB, Roeder RG, Tora L, Mantovani R The major histocompatibility complex class II Ea promoter requires TFIID binding to an initiator sequence. Mol Cell Biol, 1996, 16, 503 512.
- Tronche F, Ringeisen F, Blumenfeld M, Yaniv M, Pontoglio M Analysis of the distribution of binding sites for a tissue-specific transcription factor in the vertebrate genome. J Mol Biol, 1997, 266, 231 245.
- Oettgen P, Akbarali Y, Boltax J, Best J, Kunsch C, Libermann TA Characterization of NERF, a novel transcription factor related to the Ets factor ELF-1. Mol Cell Biol, 1996, 16, 5091 5106.
- Stepchenko AG Noncanonical Oct-sequences are targets for mouse Oct-2B transcription factor. FEBS Lett, 1994, 337, 175 178.
- Shim YH, Bonner JJ, Blumenthal T Activity of a C. elegans GATA transcription factor, ELT-1, expressed in RT yeast. J Mol Biol, 1995, 253, 665 676.
- Hyde-DeRuyscher RP, Jennings E, Shenk T DNA binding sites for the transcriptional activator/repressor YY1. Nucleic Acids Res, 1995, 23, 4457 4465.
- Merchant JL, Shiotani A, Mortensen ER, Shumaker DK, Abraczinskas DR Epidermal growth factor stimulation of the human gastrin promoter requires Sp1. J Biol Chem, 1995, 270, 6314 6319.
- Etzold,T. and Argos,P. SRS – an indexing and retrieval tool for flat file data libraries. Comput. Applic. Biosci., 1993, 9, 49-57.
Figure 1. Example of an ACTIVITY entry. The lines contaning cross-references to other databases are bold.