ANANKO E.A., KOLPAKOV F.A., KOLESOV G.B., KOLCHANOV N.A.
Laboratory of Theoretical Genetics, Institute of Cytology and Genetics, (Siberian Branch of the Russian Academy of Sciences), 10 Lavrentieva ave., Novosibirsk, 630090 Russia
Keywords: gene networks, database, automated visualization, Internet, antiviral response, regulaton of erythropoiesis, java applet
Gene networks provide the regulation of physiological processes in eukaryotic organisms. Ways and means for automated visualization of the gene networks based on their formalized description are needed. Rapidly increasing information regarding the regulation of gene expression and signal transduction pathways is hard to formalize and systematize. The main principles of a formalized description of various regulatory processes have been worked out for the GeneNet computer system designed for accumulation of the data on gene networks and their visualization through the Internet. The GeneNet system is bipartite and includes: (1) a database containing information on gene networks and (2) a Java program for automated construction of the gene network diagrams based on their formalized description in the database. The GeneNet graphical user interface allows visualization and exploration of the GeneNet database through the Internet. The GeneNet is a part of GeneExpress – an intellectual system for analysis of genomic regulatory sequences (http://wwwmgs.bionet.nsc.ru/systems/GeneExpress/), developed in the Institute of Cytology and Genetics, Siberian Branch of the Russian Academy of Sciences. GeneNet is available at http://wwwmgs.bionet.nsc.ru/systems/MGL/GeneNet/.
1. The gene network concept
Gene networks [Goto S. et al., 1997; McAdams H. and Arkin A., 1997; Savageau,M., 1985; Thomas R. et al., 1995] are gene ensembles functioning in a coordinated manner to provide for the vital functions, fine regulation of physiological processes, and responses to external stimuli. Any gene network is composed of several functional elements: (1) a gene ensemble interacting when certain biological functions are performed; (2) proteins encoded by these genes [Harada et al., 1994; Anan’ko et al., 1997]; (3) signal transduction pathways providing the gene activation in response to an external stimulus; (4) a set of positive and negative feedbacks stabilizing the parameters of the gene network (autoregulation) or providing a transition to a new functional state [Kolchanov, 1997]; and (5) external signals, hormones, and metabolites that trigger the gene network or correct its operation in response to the changes in physiological parameters.
2. The GeneNet database
2.1. Main principles of gene network formalized description
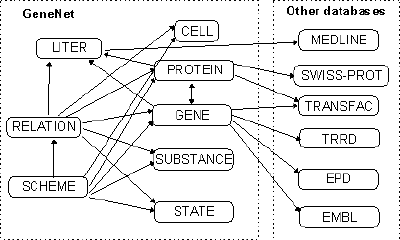
Experimental data from original papers are formalized and collected in the GeneNet database. Using the object-oriented approach, the following components are distinguished in the description of the gene network: entities (any material objects), relations between the entities, and processes occurring in them (for example, viral infection, anemia, etc.). Four classes of entities are distinguished: (1) Cell (tissue, organ) entity, regarded as a definite compartment containing a certain set of entities of other classes; (2) Protein; (3) Gene; and (4) Substance (nonprotein regulatory substance or metabolite). Species and cell types are taken into account in the description of entities. Two classes of relations between the entities are distinguished: (1) reaction, that is, the interaction between entities leading to appearance of a new entity or process, and (2) regulatory event, that is, the effect of an entity on a certain reaction. Each class of gene network components is described in its own format in a separate table (Fig. 1). The table CELL contains the information on the cell types and lineages. Tissues and organs are also described in this table. The table GENE includes the data on the genes and their regulatory features based on the information from the TRRD [Kel et al., 1995; Kel’ et al., 1997]. The data on proteins and protein complexes are collected in the table PROTEIN; on nonprotein regulatory substances and metabolites, in the table SUBSTANCE; on the physiological processes and the organismic state during the gene network functioning, in the table STATE. Relations between the gene network components are described in the separate table RELATION. The database is supplemented with two additional tables: SCHEME, which contains the description of the gene network graphs, and LITER with references to the original papers.
Figure 1. Structure of the GeneNet database with references to other databases.
2.2. Representation levels of the gene network and directionality of processes in it
Compartmentalization is a characteristic feature of the processes occurring in the gene network. Gene network components are scattered throughout different organs, tissues, cells, and cell compartments. The three hierarchical levels are considered as a first approximation to the description of the gene network: (1) the level of organism, at which the entities organs, tissues, particular types of cells, and various substances affecting other organs, tissues and cells are described; (2) the single cell level, where four compartments are distinguished: the intercellular space, the cell membrane, the cytoplasm, and the nucleus; and (3) the single gene level, at which the description of the gene transcription regulation employs the data from the TRRD database [Kel’ et al., 1997].
The directionality of the processes occurring in the gene network can be determined in many cases. There are two directions with respect to the activated genes: (1) INPUT, signal transduction pathways from the cell receptors to the genes, and (2) OUTPUT, the processes occurring in the cell after the genes responded to the signal.
2.3. Current release of the GeneNet database
Current release of the GeneNet database contains description of two gene networks: the antiviral response [Anan’ko et al., 1997] and regulation of erythropoiesis [Podkolodnaya and Stepanenko, 1997] described at the levels of organism and single cell. The gene network of lipid metabolism is under the work. Gene interdependence, signal transduction pathways, and the major features of gene network operation are included in the gene network description.
GeneNet database is available through the SRS system (http://sgi.sscc.ru/). The SRS system also supports the cross-references within the GeneNet database and to the EMBL, SWISS-PROT, TRRD, TRANSFAC, and EPD databases (Fig. 1).
3. The GeneNet user interface
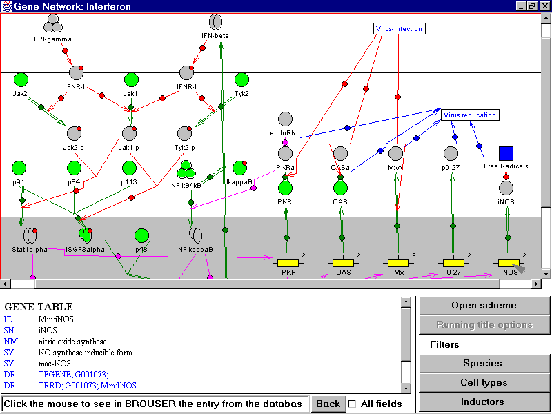
The GeneNet Viewer, which is a Java applet, includes the means for automated generation of the gene network diagram and system of filters as well as the means for data navigation including interactive images on the diagram, on-line help, interactive cross-references within the GeneNet database and references to other databases. All images on the diagram are interactive, i.e., if the user clicks the image, the textual description of the corresponding entry in the GeneNet database is displayed in a special text window under the diagram (Fig. 2). Double clicking the gene image starts the TRRD Viewer, developed using Molecular Genetics Library [Kolpakov and Babenko, 1997], and regulatory map of the gene is visualized. The text window contains a formatted text with hypertext references of three types: (1) references explaining the type of information described in the field; (2) cross-references within the GeneNet database; and (3) the references to other databases (EMBL, SWISS-PROT, TRRD, TRANSFAC, and EPD).
3.1. Automated generation of gene network diagrams
The GeneNet system is developed in such a way that diagram construction of the gene network is automated. A diagram is represented as a graph with nodes corresponding to entities or states and edges indicating relations between gene network components. Information on the graph structure is taken from the SCHEME table. Each class of the gene network components has its own image on the diagram, reflecting the features of the object.
Each of the three levels of the gene network representation is displayed in a separate window. The diagrams summarize all the experimental data on the gene network that have been so far collected in the GeneNet database (fig. 2).
3.2. Equivalence groups
The equivalent components of the gene network (for example, homologous genes or proteins obtained from different species) are represented by a single node on the diagram. In the SCHEME table, such equivalent entities are described as equivalence groups. Relations between equivalent entities are also equivalent.
Figure 2. Example of automated construction of the diagram representing the gene network of the antiviral response at the cell level.
3.3. System of filters
Note that the components of the gene network may originate from the data obtained in different species, types of experiments, and under different conditions. By default, the scheme for the gene network is drawn using all the information given in the corresponding entry of the scheme table. A system of filters allows to select particular components of a gene network for visualization depending on the species, cell type, and inducer. The GeneNet is provided with filters of three types according to (1) species, (2) cell type, and (3) inducer. All three filters can be applied to the diagram of the gene network at the cell level, whereas only the species filter is accessible at the organism level.
An appropriate filter contains the list of all species, cell types, or inducers for all the objects on the diagram. One, several, or all elements listed can be selected from the corresponding filter. All the three filters can be used simultaneously. As a result, only the objects that meet the requirements of all the filters, will be displayed on the diagram. Note that application of the filters does not change the positions of the entities on the diagram, simplifying the visual comparison of the diagrams.
4. Acknowledgments
This work was supported by the State Science and Technology Program “The Human Genome” of the Russian State Committee for Science and Technology, Russian Foundation for Basic Research (grants 96-04-50006, 97-04-49740, 98-04-49479), and Integration Program of the Siberian Branch of the Russian Academy of Sciences.
References:
- Ananko, S.I. Bazhan, O.E. Belova, and A.E Kel. “Mechanisms of transcription of the interferon-induced genes: a description in the IIG-TRRD information system” Mol. Biol. (Mosk)., 31, 592-604 (1997).
- Goto, S., Bono, H., Ogata, H., Gujibuchi, W., Nishioka, T., Sato, K. and Kahensia, M. “Organizing and computing metabolic pathways data in terms of binary relations.” Pac. Symp. Biocomput.,175-186 (1997).
- Harada, E.I. Takahashi, S Itoh, K. Harada, T.A. Hori, and T. Taniguchi “Structure and regulation of the human interferon regulatory factor 1 (IRF-1) and IRF-2 genes: implications for a gene network in the interferon system” Mol. Cell. Biol., 14, 1500-1509 (1994).
- Kel O.A., A.G. Romaschenko, A.E. Kel, E. Wingender, and N.A. Kolchanov “A compilation of composite regulatory elements affecting gene transcription in vertebrates” Nucleic Acids Res., 23, 4097-4103 (1995).
- Kel A.E., N.A. Kolchanov, O.V. Kel, A.G. Romashchenko, E.A. Ananko, E.V. Ignateva, T.I. Merkulova, O.A. Podkolodnaya, I.L. Stepanenko, A.V. Kochetov, F.A. Kolpakov, N.L. Podkolodny, and A.N. Naumochkin “TRRD: database on transcription regulatory regions of eukaryotic genes” Mol. Biol. (Mosk)., 31, 521-530 (1997).
- Kolchanov N.A. “Transcription regulation in eukaryotic genes: databases and computer analysis” Mol. Biol. (Mosk)., 31, 481-483 (1997).
- Kolpakov F.A. and Babenko V.N.“Computer system MGL: a tool for sample generation, visualization, and analysis of regulatory genomic sequences” Mol. Biol. (Mosk)., 31, 540-547 (1997).
- Kolpakov F.A., Ananko E.A., Kolesov G.B., Kolchanov N.A. “GeneNet: a database for gene networks and its automated visualization through the Internet” Bioinformatics, in press., (1998).
- McAdams, H. and Arkin, A. “Stochastic mechanism in gene expression.” Proc. Natl. Acad. USA, 94, 814-819 (1997).
- Podkolodnaya O.A. and Stepanenko I.L. “Mechanisms of transcription regulation of the erythroid-specific genes” Mol. Biol. (Mosk)., 31, 562-574 (1997).
- Savageau, M. “A theory of alternative designs for biochemical control systems.” Biomed. Biochim. Acta., 44, 875-880 (1985a).
- Thomas, R., Thieffry, D., Kaufman, M. “Dynamical behavior of biological regulatory networks. Biological role of feedback loops and practical use of the concept of the loop-characteristic state.” Bul. Math. Biol. 57(2) 247-276 (1995).


