PONOMARENKO M.P., KOLCHANOV N.A., PONOMARENKO J.V., FROLOV A.S., PODKOLODNAYA O.A., VOROBIEV D.G., PODKOLODNY N.L.1, OVERTON G.C.2
Laboratory of Theoretical Genetics, Institute of Cytology and Genetics, Siberian Branch of the Russian Academy of Sciences, 10 Lavrentiev Ave., Novosibirsk, 630090, Russia;
1Institute of Computational Mathematics and Mathematical Geophysics, Novosibirsk, Russia;
2Center for Bioinformatics, University of Pennsylvania, Philadelphia, USA
Keywords: prediction, confirmation and physico-chemical DNA properties, activity, DNA functional sites, utility theory for decision making, fuzzy logic
We suggest an approach to predict the activity of DNA functional sites via “a probable molecular mechanism of the site functioning”. Mean values of certain DNA physico-chemical or conformational properties for a given DNA region containing the site are used. The database ACTIVITY of the functional DNA site activities is the initial data source for this approach implementation. From these data, the mean values applicable to predict the site activities were identified and their programs compiled into the knowledge base (C-code) and library (executable), http://wwwmgs.bionet.nsc.ru/systems/Activity/.
Introduction
Mulligan (1984) was the first to predict the DNA site activity through homology score; Stormo (1986), through weight matrixes; Berg and von Hippel (1988), through statistical mechanics generalizing the above descriptive approaches; and Jonsson (1993), through neural networks optimized heuristically. These approaches are still dominant (Kraus, 1996; Fields, 1997). Earlier, we performed such predictions using oligonucleotide content (Ponomarenko, 1997a,b) and calculated theoretically the TATA-box consensus from the DNA/TBP-affinity: it 13 from 15 possible matches with the consensus of the actual TATA box (Bucher, 1990). Nevertheless, a probable molecular mechanism of the site functioning remains obscure in terms of either homology score (Mulligan; 1984), weighted matrix (Stormo, 1986), neural network (Jonsson, 1993) or oligonucleotide content (Ponomarenko, 1997a,b). That is why, we have studied the applicability of the conformational and physico-chemical DNA properties to predicting the site activities from their sequences.
System and methods
We are suggesting a linear regression for predicting the activity values of a given DNA functional site through the mean values of the physico-chemical and conformational DNA properties for a given DNA region containing this site (“DNA properties”). We also suggest to generate and test as many DNA properties as the computer can afford, as it was introduced by Hajek and Havranek (1978). Earlier, this Ğgenerating and testingğ has been successfully applied to sequence analysis (Ponomarenko, 1997a).
Within the framework of the linear regression, the activity of the site with sequence S is predicted as follows:
|
|
(1) |
where, F0 is a Ğbasal activityğ; Xk,a,b(S), the mean value of the qth property Rq for the region from a to b:
|
|
(2) |
Table 1 lists the 38 conformational and physico-chemical properties Rq utilized in this work. Each of them is examined exhausting all the possible regions (a, b) within the site; therefore, the total number of the DNA properties Xq,a,b generated and tested is about 105. Essentially, when such a huge number of tests is carried out, the problem to exclude any insignificant choice by chance becomes crucial. We are crossing this problem within the framework of Utility Theory for Decision Making (Fishburn, 1970) and fuzzy logic (Zadeh, 1965). For fixed “q,a,b“, the Xq,a,b(Sn) value for each sequence Sn with the known activity Fn is calculated (2). When the pairs {Xq,a,b(Sn), Fn} meet all the necessary requirements of the linear regression (1) applicability, the activity F is predictable through the property Xq,a,b. To test these conditions of linear regression applicability, a simple regression is optimized for the pair {Xq,a,b(Sn), Fn}:
|
|
(3) |
To ensure the reliability of the regression between Xq,a,b(Sn) and Fn, 22 requirements are tested: the presence of linear, sign, and rank correlations between the predicted Fq,a,b(Sn) and the experimental Fn activities; the uniform distributions; the Gaussian for their deviation (Fq,a,b(Sn)-Fn), etc. When the rth requirement is met with significance pr, it is fixed on a uniform scale named Ğpartial utility of the Xq,a,b to predict the activity Fğ which is highest, ur=1, when the rth requirement is met at pr <0.01; the lowest, ur= -1, when pr>0.1; negative ur<0, when pr>0.05; positive ur>0, when pr<0.05; and ur=0, when pr=0.05, as it is recommended by fuzzy logic (Zadeh, 1965):
|
|
(4) |
Applying the Utility Theory for Decision Making (Fishburn, 1970), the partial utilities are averaged to produce the general utility:
|
|
(5) |
The linear-independent properties Xq,a,b with the highest positive utilities are selected, U(Xq,a,b,F)>0. The probability to select by chance a property X with a positive utility U(X, F)>0 from 105 properties was approximately estimated by the binomial criterion:
![]() .
.
Thus, the property Xq,a,b selected meets significantly the linear regression requirements. That is why the simplest combinatorial algorithm is applicable: all the 105 possible properties Xq,a,b(Sn) for all the available site sequences Sn with the known activities Fn are calculated (2), and all the 105 utilities U(X, F) are calculated (3-5). If all U(Xq,a,b, P)<0, no properties are selected; otherwise, all the possible linear-independent properties {Xk} with highest utilities {U(Xk, F)>0} are selected; the linear regression (1) is optimized; its program is generated and stored with the SRS-based (Etzold, 1993) knowledge base.
Results and discussion
Table 1 shows the transcription activity of the mouse ![]() A-crystalline gene promoter with the PE1B/TATA region (Sax, 1995) as an example of the initial data for the analysis described above; Table 2, the physico-chemical property “Probability to be contacting with nucleosome core” (Hogan, 1987). The output for these initial data are demonstrated in Fig. 1. The C-program predicting transcription activity of the mouse
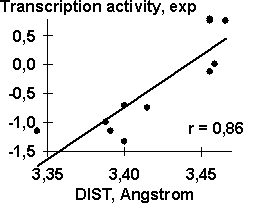
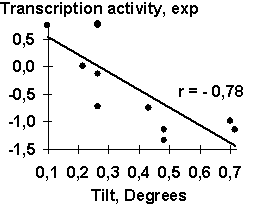
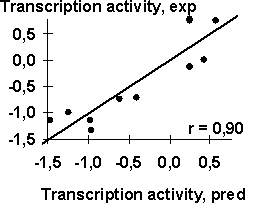
A-crystalline gene promoter with the PE1B/TATA region (Sax, 1995) as an example of the initial data for the analysis described above; Table 2, the physico-chemical property “Probability to be contacting with nucleosome core” (Hogan, 1987). The output for these initial data are demonstrated in Fig. 1. The C-program predicting transcription activity of the mouse ![]() A-crystalline gene promoter from the DNA sequence of PE1B/TATA box region (Fig. 2a) using the property ĞProbability to be contacting with nucleosome coreğ, Pnucl (Fig. 2b), the major groove distance, dist (Fig. 2c), and the Tilt angle (Fig. 2d):
A-crystalline gene promoter from the DNA sequence of PE1B/TATA box region (Fig. 2a) using the property ĞProbability to be contacting with nucleosome coreğ, Pnucl (Fig. 2b), the major groove distance, dist (Fig. 2c), and the Tilt angle (Fig. 2d):
![]()
The negative value, -0.1, multiplying the ĞProbability to be contacting with nucleosome coreğ means that the tighter is the interaction of the promoter with nucleosomes, the lower is the transcription activity. That is consistent with the experimental data that the nucleosome displacement from a promoter precedes the TBP/DNA binding (Godde, 1995; Edmondson, 1996). The linear correlation coefficient r=0.90 shows the significant agreement between the experimental and the predicted transcription activities (Fig.2a).
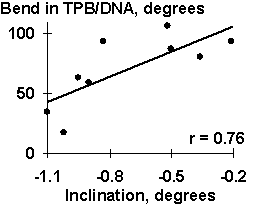
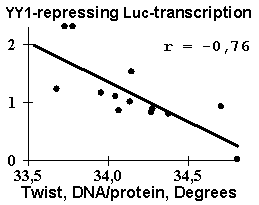
Several dozens of DNA functional sites analyzed by the Activity system are shown in Table 4 and Fig. 3 to demonstrate the universality of the linear regression (1). The DNA bending in the TBP/TATA complex (Starr, 1995) was demonstrated to correlate with the Inclination (Fig. 3a). That agrees with the X-ray structure of the complex (Juo, 1996), where the DNA bend results from intercalation of four phenylalanines of the TBP into the DNA minor groove, which widens with the Inclination (Dickerson, 1989). Fig. 3b illustrates that USF/DNA affinity (Bendall, 1994) is correlates negatively with the Twist angle (Table 3: r=-0.896, p<10-5). This is consistent with the negative correlation (r=-0.766, p<10-3) between the activity of another transcription factor (YY1) binding site (Fig. 3d). These two results are agreeing with one another and with our earlier data (Ponomarenko, 1997c) that the lowest twist is significant for the promoters. As for exotic activity, the 2-aminopurine-induced mutability (Coullondre, 1978) correlates with the DNA melting temperature in the vicinity of the mutation point (r=0.90, ![]() <10-5). This agrees with the commonly accepted fact (Mhaskar, 1984) that the mutability of this kind results from repair errors, the frequency of depends on the DNA melting temperature. Very close estimates (r=0.865 and r=0.860, respectively) were obtained earlier using weight matrices (Stormo, 1986) and oligonucleotide content (Ponomarenko, 1997a). These contextual correlations have not unambiguously indicated the repair errors dependent on DNA melting temperature as a possible molecular mechanism of DNA mutability.
<10-5). This agrees with the commonly accepted fact (Mhaskar, 1984) that the mutability of this kind results from repair errors, the frequency of depends on the DNA melting temperature. Very close estimates (r=0.865 and r=0.860, respectively) were obtained earlier using weight matrices (Stormo, 1986) and oligonucleotide content (Ponomarenko, 1997a). These contextual correlations have not unambiguously indicated the repair errors dependent on DNA melting temperature as a possible molecular mechanism of DNA mutability.
All the results obtained demonstrate that the linear regression (1) can be informative in molecular biological studies. Further development of this approach will be focused on involving more and more novel conformational and physico-chemical DNA properties into the analysis of the activity of DNA functional sites and to supplement the linear regression with more complex and sensitive nonlinear approaches.
We are grateful to Ms. Galina Chirikova for help in translation. This work was supported by NIH (grant 2-R01-RR04026-08A2), Russian National Human Genome Project, Russian Ministry of Science and Technical Politics, Siberian Branch of Russian Academy of Sciences (grants IGSBRAS-97N13), and Russian Foundation for Basic Research (grants 96-04-50006, 97-07-90309, 97-04-49740, and 98-07-90126).
References
- A.J. Bendall and Molloy, P.L., Nucleic Acids Res., 22, 2801 (1994).
- O.G. Berg and P.H. von Hippel, J. Mol. Biol., 200, 709 (1988).
- C. Coulondre, et al., Nature., 274, 775 (1978).
- R.E. Dickerson, et al., EMBO J., 8, 1 (1989).
- D.G. Edmondson and S.Y. Roth, FASEB J., 10, 1173 (1996).
- T. Etzold and P. Argos, Comput. Appl. Biosci., 9, 49 (1993).
- D.S. Fields, Y. He, A.Y. Al-Uzri, and G.D. Stormo, J. Mol. Biol., 271, 178 (1997).
- P.C. Fishburn, Utility Theory for Decision Making, NY: Jonh Wiley & Sons, (1970).
- J.S. Godde, Y. Nakatani, and A.P. Wolffe, Nucleic Acids Res., 23, 4557 (1995).
- P. Hajek, and T. Havranek, Mechanizing hypothesis formation. Heidelberg, Springer Verlag, (1978).
- M.E. Hogan and R.H. Austin, Nature, 329, 263 (1987).
- R. Hyde-DeRuyscher, E. Jennings, and T. Shenk, Nucleic Acids Res., 23, 4457 (1995).
- J. Jonsson, et al., Nucleic Acids Res., 21, 733 (1993).
- Z.S. Juo, T.K. Chiu, et al., J. Mol. Biol., 261, 239 (1996).
- R.J. Kraus, et al., Nucleic Acids Res., 24, 1531 (1996).
- D.N. Mhaskar and M.F. Goodman, J. Biol. Chem., 259, 11713 (1984).
- M.E. Mulligan, et al., Nucleic Acids Res. 12, 789 (1984).
- M.P. Ponomarenko, A.N. Kolchanova, and N.A. Kolchanov,. J. Comput. Biol., 4, 83 (1997a).
- M.P. Ponomarenko, L.K. Savinkova, et al., Mol. Biol. (Mosk.)., 31, 726 (1997b).
- M.P. Ponomarenko, J.V. Ponomarenko, et al., Mol Biol (Mosk)., 31, 733 (1997c).
- C.M. Sax, A. Cvelk, et al., Nucleic Acids Res., 23, 442 (1995).
- D.B. Starr, B.C. Hoopes, and D.K. Hawley, J. Mol. Biol., 250, 434 (1995).
- G.D. Stormo, T.D. Schneider, and L. Gold, Nucleic Acids Res., 14, 6661 (1986).
- L.A. Zadeh, Information and Control., 8, 338 (1965).
Table 1. An example of the experimental data that are analyzed in this work
|
Name |
Sequence of the PE1B/TATA region of mouse |
Act |
|
M18 |
CACGCATAGG GAGTTCTGGA ACGCTAGCTC ACCACC |
0.78 |
|
M15 |
CACGCATACC GAGGGCTGGA ACGCTAGCTC ACCACC |
0.75 |
|
M17 |
CACGCATAGG GCTGGCTGGA ACGCTAGCTC ACCACC |
0.75 |
|
WT |
CATATATAGG GAGGGCTGGA ACGCTAGCTC ACCACC |
0.00 |
|
M6 |
CACGCATAGG GAGGGCTGGA ACGCTAGCTC ACCACC |
-0.13 |
|
M16 |
CACGCATAGC CAGGGCTGGA ACGCTAGCTC ACCACC |
-0.72 |
|
M5 |
GCAGGCATAT ATAGGGAGGG CTGCTAGCTC ACCACC |
-0.75 |
|
M2 |
TGCAGGCAGG GAGGGCTGGA ACGCTAGCTC ACCACC |
-1.00 |
|
M1 |
CATAGATAGG GAGGGCTGGA ACGCTAGCTC ACCACC |
-1.15 |
|
M4 |
TGCAGGCATA TATAGGGAGA ACGCTAGCTC ACCACC |
-1.15 |
|
M3 |
GTGCAGGCAT ATATACTGGA ACGCTAGCTC ACCACC |
-1.34 |
Table 2. Example of a DNA property used: Probability to be contacting with nucleosome core (Hogan, 1987)
|
Dinucleotide |
% |
Dinucleotide |
% |
Dinucleotide |
% |
Dinucleotide |
% |
|
AA |
18.4 |
AT |
7.2 |
AG |
14.5 |
AC |
10.2 |
|
TA |
6.2 |
TT |
18.4 |
TG |
15.7 |
TC |
11.3 |
|
GA |
11.3 |
GT |
10.2 |
GG |
10.2 |
GC |
5.2 |
|
CA |
15.7 |
CT |
14.5 |
CG |
1.1 |
CC |
10.2 |
|
A) |
B) |
|
C) |
D) |
| Fig. 2. The transcription activity of mouse |
|
Table 3. Examples of the functional DNA sites analyzed in this work
|
Site |
DNA property found |
Significance |
|||||||
|
Name |
Position #1 |
n |
Activity, F |
Xk |
Region |
Property |
U |
r |
p |
|
PE1B TATA box |
Transc- |
11 |
Transcription |
X1 |
-32; -25 |
Pnucl |
0.36 |
-0.77 |
10-2 |
|
(Sax, 1995) |
ription |
activity |
X2 |
-29; -19 |
DIST |
0.41 |
0.86 |
10-3 |
|
|
start |
of alphaA- |
X3 |
-31; -25 |
Tilt |
0.38 |
-0.78 |
10-2 |
||
|
crystalline |
F=-39-0.1*X1+12*X2-X3 |
0.90 |
10-4 |
||||||
|
TATA box (mutant) |
TATA |
9 |
DNA bending |
X1 |
0, 9 |
Inclination |
0.19 |
0.76 |
0.05 |
|
(Starr, 1995) |
box start |
in TBP/TATA |
F=120.15+70.32*X1 |
0.76 |
0.05 |
||||
|
USF-binding site |
Synthetic |
14 |
USF/DNA |
X1 |
11, 15 |
Depth |
0.22 |
-0.78 |
10-3 |
|
(Bendall, 1994) |
DNA |
affinity |
X2 |
11; 20 |
Twist |
0.23 |
-0.86 |
10-4 |
|
|
start |
F=170-16.3*X1-0.7*X2 |
0.91 |
10-5 |
||||||
|
YY1-binding site |
site start |
21 |
Transcription |
X1 |
1, 12 |
Twist |
0.27 |
-0.76 |
10-2 |
|
(Hyde-DeRuyscher, 1995) |
repression |
F= 47.97 -1.37*X1 |
0.76 |
10-2 |
|||||
|
2AP-induced mutation |
Mutation |
26 |
Mutation |
X1 |
-1, 2 |
Tmelt |
0,20 |
0.90 |
10-5 |
|
(Coullondre, 1978) |
point |
frequency |
F=-8.5568+0.1585*X1 |
0.90 |
10-5 |
||||
n, total number of the site variants; Xk, property selected; U, utility; r, p, linear correlation coefficient and its significance; Pnucl, probability to be contacting with nucleosome core; Tmelt, melting temperature; depth, minor groove depth; width, minor groove width; WIDTH, major groove width; DIST, major groove width distance; and ![]() , the linear regression (Equation 1) predicting the site activity.
, the linear regression (Equation 1) predicting the site activity.
|
A) |
B) |
|
C) |
D) |
| Fig. 3. Examples of the ACTIVITY predictions: (a) the DNA bend within the TBP/TATA complex (Hogan, 1987) correlates with the inclination; (b) USF/DNA affinity (Bendall, 1994) correlates with the twist; (c) YY1 transcription repression activity (Hyde-DeRuyscher, 1995) correlates with the twist; and (d) the mutability induced by 2-aminopurine (Coullondre, 1978) correlates with the melting temperature | |


