SELEDTSOV I.A., KOLPAKOV F.A.+
Institute of Cytology and Genetics, Siberian Branch of the Russian Academy of Sciences, 10 Lavrentiev Ave., Novosibirsk, 630090, Russia;
fedor@bionet.nsc.ru
+Corresponding author
Keywords: statistical significance, nucleotide sequence alignment, regression analysis
Abstract
Statistical significance of the similarity observed is the main question while comparing sequences. This problem has not yet been solved mathematically for optimal aligning of the sequences containing insertions and deletions. We have carried out the regression analysis of the observed similarity of random sequences depending on their length and nucleotide composition and are proposing a practical method to estimate the probability of the similarity observed to be statistically significant. The regression parameters being determined for a given alignment scheme (similarity matrix and penalties for deletions) for a pair of nucleotide sequences, the statistical significance of the similarity observed can be precisely estimated basing on only their lengths and nucleotide composition.
1. Introduction
This work is dealing with estimation of the statistical significance of the similarity observed while aligning a pair of nucleotide sequences. The researcher always needs to know whether the alignment he has obtained actually indicates any functional and/or evolutionary relationship between the sequences or is just accidental. Statistical estimation is the tool able to answer the question how frequently the alignment of this type can appear by chance. If the probability of such event is low, we can consider the event improbable and, consequently, the sequences related to a certain degree.
Numerous works are devoted to estimation of the statistical significance of the alignment observed, due to the importance of this problem. However, the approaches proposed in these works have the following common limitations:
- Their applicability to only local similarity regions.
- Necessary negative values of the expectation of a dot-matrix element which is not always possible within the existing alignment schemes (symbol similarity matrix, penalties for deletions and insertions, etc.).
- The implication that the sequences compared have equal or approximately equal lengths.
- No consideration of the particular nucleotide composition of the sequences compared, distorting the estimation considerably.
Note that the limitations (c) and (d) are partially overcome in the approach proposed by Waterman and Vingron (1994). The goal of this work was to develop the method for estimating statistical significance of the observed alignment of two sequences free from the above-listed disadvantages.
2. The proposed approach
Let’s consider the weight determined according to the following equation as a measure of the quality of the alignment of two sequences:
![]() ,
,
where ![]() are the values of the similarity of the symbols i and j; p1(i) and p2(i), the symbols located in the ith alignment positions of the first and second sequences, respectively; L, the effective alignment length; K, the total number of insertions in the alignment; and d , the penalty for each insertion. S, d , and the selection of L represent the alignment scheme. The alignment with the maximal value of the weight *W exists among all the possible alignments of two sequences. *W is an random variable with a certain distribution function FS,r ,d ,L1,L2(*W), where r is a totality of the parameters describing the difference in the nucleotide compositions of the first and second sequences; L1, the length of the first sequence; and L2, the length of the second sequence. The tail area of the distribution function
are the values of the similarity of the symbols i and j; p1(i) and p2(i), the symbols located in the ith alignment positions of the first and second sequences, respectively; L, the effective alignment length; K, the total number of insertions in the alignment; and d , the penalty for each insertion. S, d , and the selection of L represent the alignment scheme. The alignment with the maximal value of the weight *W exists among all the possible alignments of two sequences. *W is an random variable with a certain distribution function FS,r ,d ,L1,L2(*W), where r is a totality of the parameters describing the difference in the nucleotide compositions of the first and second sequences; L1, the length of the first sequence; and L2, the length of the second sequence. The tail area of the distribution function ![]() (
( ![]() , where Ds is the dispersion of *W; Av, the mathematical expectation of *W) appears to have the same analytic form for all the possible values of S, r , d , L1, and L2, namely:
, where Ds is the dispersion of *W; Av, the mathematical expectation of *W) appears to have the same analytic form for all the possible values of S, r , d , L1, and L2, namely:
![]() (1)
(1)
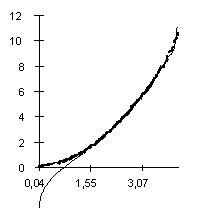
where  is the tail area of the normal distribution (Fig. 1)

Figure 1. Correspondence of the logarithms of the functions ![]() (bold line) and
(bold line) and ![]() (fine line).
(fine line).
Thus, we only need to determine a concrete dependence of the coefficients A, B, and C on the lengths of the sequences aligned, their composition, and alignment scheme. It is interesting to consider the distribution function of the variable:
![]() (2)
(2)
The corresponding function will be designated ![]() hereinafter. This function appears the same for all the possible values of S, r , d , L1, and L2, and the corresponding parameters (see equation 1) A’, B’, and C’ can be easily calculated. It should be emphasized that the values of these coefficients are calculated only once and are independent of S, r , d , L1, and L2. Thus, the only thing we need to do is to determine the dependence of Av and Ds on S, r , d , L1, and L2. The problem is solved when this dependence is determined.
hereinafter. This function appears the same for all the possible values of S, r , d , L1, and L2, and the corresponding parameters (see equation 1) A’, B’, and C’ can be easily calculated. It should be emphasized that the values of these coefficients are calculated only once and are independent of S, r , d , L1, and L2. Thus, the only thing we need to do is to determine the dependence of Av and Ds on S, r , d , L1, and L2. The problem is solved when this dependence is determined.
3. Regression analysis
Described in this section is the determination of the dependences of Av and Ds on L1, L2, and r , that is, on the parameters independent of the alignment scheme. Determination of their dependence on the scheme is the goal for further studies. Linear regression analysis was employed to determine the dependence of Av and Ds on L1, L2, and r .
3.1. The dependence on the nucleotide sequence lengths
The fixed nucleotide composition provided, the dependence of Av and Ds on the lengths of the sequences aligned is:
![]() (3)
(3)
![]() (4)
(4)
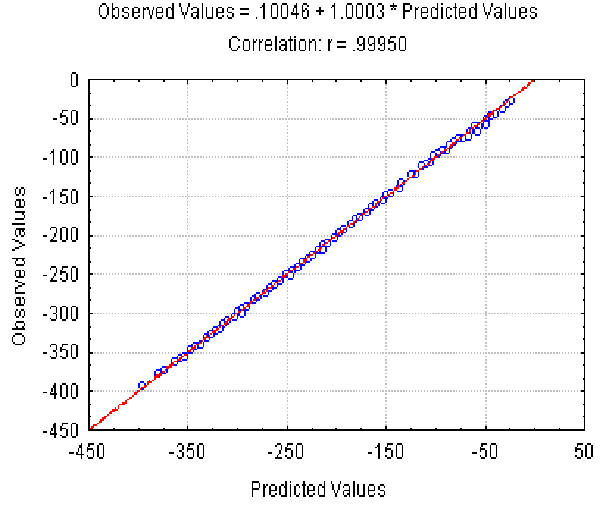
The dependence of the Av value observed on the predicted value at different lengths of the sequences (the lengths varied from 20 to 500 bp) is shown in Fig. 2. It illustrates that equation 3 provides a good approximation of the observed Av values. Approximation of the Ds values by equation 4 is of the same accuracy (not shown).
3.2. Dependence on the nucleotide sequence composition
However, the nucleotide sequences enriched with one and the same nucleotide will be inclined to display higher values of the alignment weights. Thus, it is necessary to take into account the differences in their nucleotide composition while estimating the statistical significance of the alignment observed.
 |
| Figure 2. The dependence of the observed Av value on the predicted Av(l) at different lengths and fixed nucleotide composition of the aligned sequences. X axis, predicted Av(l) values; Y axis, observed values. |
 |
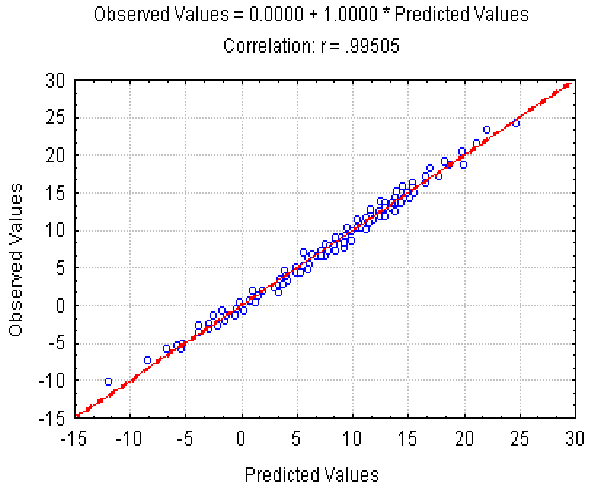
| Figure 3. The dependence of the observed Av value on the predicted value at different r and fixed lengths of the sequences. X axis, predicted Av(r ) values; Y axis, observed values. |
We used the following variables to describe the differences in the nucleotide composition:
![]() , that reflects the probability of nucleotide coincidence and
, that reflects the probability of nucleotide coincidence and
![]() , that reflects the difference in the nucleotide composition,
, that reflects the difference in the nucleotide composition,
where fk(i) is the frequency of the ith nucleotide in the sequence k.
The fixed and equal lengths (L1=L2) of the nucleotide sequences provided, the dependence of Av and Ds on p and dP can be represented as:
![]() (5)
(5)
![]() (6)
(6)
The dependence of the observed Av value on the Av(r ) predicted at different r (different nucleotide composition) is shown in Fig. 3. It illustrates that equation 5 provides a good approximation of the Av values observed. Equation 6 gives slightly worse approximation (the correlation coefficient is 0.91) for Ds values (not shown).
3.3. Dependence on the lengths and nucleotide compositions
We suggested the following general view of the Av and Ds dependences on the lengths and nucleotide compositions:
Av(l,r ) ~ Av(l)*Av(r )
Ds(l, r ) ~ Ds(l)*Ds(r )
Then, the Av and Ds dependences on the sequence lengths (at L=L1=L2), p and dP values can be represented by the following equations:
![]() (7)
(7)
![]() (8)
(8)
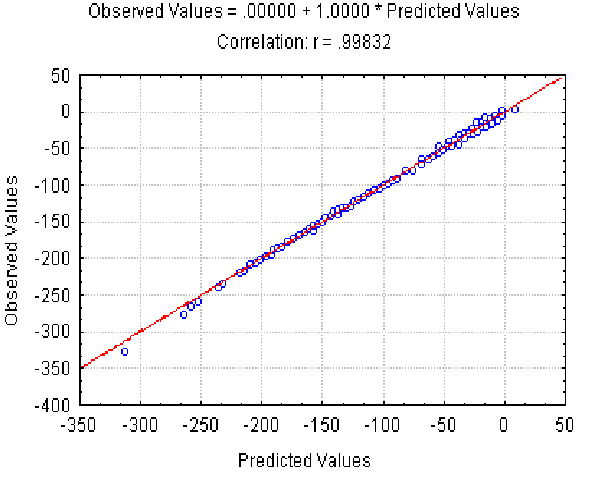
The dependence of the observed Av value on the Av(l, r ) predicted at different l and r is shown in Fig. 4. It illustrates the good approximation of the Av values observed provided by equation 7. Equation 8 gives the similar accuracy approximation for the Ds values (not shown).
 |
| Figure 4. The dependence of the observed Av value on the Av(l,) predicted at different L and r . X axis, predicted Av(l, r ) values; Y axis, observed values. |
4. Conclusion
If we have a certain alignment with the weight *W, it is possible to estimate the values of Av and Ds using equations 3-8, find *W’ using equation 2, determine directly its statistical significance using equation 1, and have the basis to speak about certain relatedness of the sequences aligned.
Study of the behavior of Av and Ds at L1![]() L2 and an arbitrary nucleotide composition is currently in progress. The dependence on the aligned scheme is also planned to be studied.
L2 and an arbitrary nucleotide composition is currently in progress. The dependence on the aligned scheme is also planned to be studied.
Appendix
The Needleman-Wunsch algorithm was used for nucleotide sequence alignment (Needleman, Wunsch, 1970).
Pair alignment of 1000-10 000 randomly generated sequences was carried out to estimate the observed Av and Ds and values.
The following alignment schemes were studied: considering and not considering the terminal gaps; with various matrices of nucleotide symbol similarity, and with different penalties for gaps and its origination.
Acknowledgements
The work was supported by the State Scientific Program “The Human Genome” of the Russian State Committee for Science and Technology and the Russian Foundation for Basic Research (grant No. 96-04-50006).
References
- S.B. Needleman and C.D. Wunsch, “A general method applicable to the search for similarities in the amino acid sequences of two proteins”, J. Mol. Biol. 48, 443 (1970)
- M. Waterman and M. Vingron, “Rapid and accurate estimates of statistical significance for sequence data base searches”, Proc. Natl. Acad. Sci. USA, 91, 4625 (1994)
