EDWARDS Y.J.K.+, FRITH M., ELGAR G., BISHOP M.J.
UK Human Genome Mapping Project Resource Centre, Wellcome Trust Genome Campus, Hinxton, Cambridge, CB10 1SB, UK.;
e-mail: yjedward@hgmp.mrc.ac.uk;
+Corresponding author
Keywords: nucleotide sequence, coding regions, protein binding sites, context analysis, multiple sequence alignment
Abstract
Theatre is a novel tool for the comparative study and presentation of quality displays of functional and structural features of DNA sequences. Theatre implements commonly used sequence analysis tools and sequence databases to determine or predict the positions of coding regions, repetitive sequences and transcription factor binding sites in families of DNA sequences. Theatre enables the user to visualise inter-related and diverse the information in a manner that aids investigating function and is useful for studying patterns of variation in families of homologous genes [16].
1. Introduction
Theatre has been designed for the comparative study of equivalent gene systems and context analysis of genomic features especially with respect to genomic regions involved in the regulation of gene expression. The identification of conserved functional signals can be key in understanding evolutionary diversity within related genomic systems. Comparative analysis of equivalent genomic systems from different species can lead to the identification of similar patterns of genomic features. Based on such comparative studies, biochemical experiments can be rationally designed to test possible functions of conserved signals and therefore lead to identifying similar patterns of development and differentiation shared by different organisms. In this respect, Theatre presents a flexible system for performing the bioinformatics component of such research with more efficiency. There are three stages to using Theatre. First, an alignment is produced; second, a databank of genomic features is generated using the sequence analysis programs; and third, the generated data is used and summarised to produce comprehensive graphical displays in colour. The information is intuitively displayed and can reveal patterns that might not otherwise have been noticed and provides an aid to investigating function.
2. Sequence analysis tools & using Theatre
Theatre is written in the C, generates PostScript output and implements bioinformatics resources such as sequence databases and sequence analysis tools which run on UNIX SUN Workstations to investigate the presence of functional and structural features in DNA sequences. The use of Theatre involves three steps which include creating a multiple sequence alignment, construction of a databank of genomic features and the production of graphical displays. The first stage involves the generation of a multiple DNA sequence alignment using a multiple sequence alignment program such as Clustal [1].
A Theatre program MSD (Make Sequence Databank of genomic features), generates scripts to run sequence analysis tools to construct a databank of genomic features to be investigated. Theatre displays three main categories of genomic features, ie., coding regions, repetitive DNA, and regions affecting gene expressions such as likely transcription factor binding sites and CpG islands. Eight programs are used for identifying regions of interest in DNA sequences. Coding regions for tRNA and protein sequences are considered by Theatre using four approaches. The EMBL database exon assignments [2], DNA sequence BLAST searches [3] against the SWISSPROT database [4], the Genemark ORF predictions [5] can be used to locate likely and true protein coding regions and Pol3scan [6] looks for tRNA genes. EMBL exon assignments when available are the most accurate for determining the positions of protein coding regions as they can provide valuable information of the 5’ regions and 3’ regions as well as the 5’ UTR and 3’UTR and these regions usually contain information with regards to processing of transcripts. Transcription factor binding sites were of particular interest to us, and they can be searched for using Consinspector [7], Matinspector [8], or Signalscan [9]. ConsInspector version 3.0 searches for protein binding sites in DNA sequences [7] (ie., 16 vertebrate transcription factor binding sites and 21 others from protozoan, viral and yeast regulatory regions of genomes). MatInspector version 2.0 performs matrix searches in the nucleotide sequences [8]. A selection from 246 protein binding sites can be made. Signalscan uses string searches from databases of compiled transcription factor binding sites to find transcription factor binding sites [9]. The TRANSFAC database [10] is used by Consinspector [7], Matinspector [8] and Signalscan [9]. CpGplot identifies CpG islands [11] as these are defined as regions longer than 200 bases with a moving average of %(G+C) above 50% and moving average of observed/expected CpG dinucleotide content greater than 0.6. The positions of microsatellites can be determined by the program Censor [12].
The third stage involves genomic feature formatting and display to highlight the relationships among genomic features and amongst equivalent genomic regions. Theatre requires specified commands to produce a PostScript file that may be printed on a PostScript laser printer or viewed using a Postscript previewer such as GhostView. General statistical information such as the nucleotide composition, nucleotide sequence biases and ratios of the observed and expected for the 16 dinucleotides and intron position and sizes are computed for the sequences investigated.
3. Comparative DNA sequence analysis using Theatre
Theatre produces a concise graphical display and a detailed output. The detailed display shows the individual nucleotides and may run over many pages (this is not shown here) whilst concise display covers a single page, depending on the sequence lengths. Figure 1 shows the Theatre concise display which is an alignment of six a-skeletal actin genes. Sequences are obtained from the EMBL nucleotide sequence databank [2] and the accession names are given in following parenthesis. Two a-skeletal actin genes are from the pufferfish Fugu rubripes (fr38850, fr38958) [13] and one from human (hssaact), mouse (mmacasa), bovine (bt02285) and pig (ss16368). The a-skeletal actin genes are expressed in similar tissue types ie., skeletal and heart tissue. In addition, the second Fugu a-skeletal actin gene (fr38958) is expressed in gills and skin [13].
In this example, the data from the exon assignments of EMBL, the programs Censor, CpGPlot and Matinspector are included. The coding regions, splice sites (intron/exon and exon/intron boundaries) and general gene organization are highly conserved in all species. The Matinspector binding sites shown are muscle-specific, and the concise display show they cluster at the 5’ end and 3’ end and they are present with higher density in the introns than the exon regions. The predicted protein binding sites vary but, there is a highly conserved TATA box and SRF protein binding sites in the promoter regions and this can be seen in the consensus feature level. Fr38958 is the only a-skeletal actin gene lacking a predicted TATA box in the promoter region of the transcription start site although there is one present further upstream and this is not similar to the other a-skeletal actin genes. The observed/expected ratio for the CpG dinucleotide content is low in mouse (0.47) compared to Fugu rubripes ((fr38850, 0.69), (fr38958, 0.90)) human (0.74), bovine (0.78) and pig (0.70) genes and this of course results in a lower adundance of CpG islands present in the mouse actin gene compared to the other species. The microsatellites are found in intron three of human, intron one of fr38850 and at the 3’ end of fr38958. No microsatellite are found in the protein coding regions. All the a-skeletal actin genes here have 6 introns. In general, the intron and gene sizes of the Fugu genes span one seventh of equivalent regions in other vertebrate species [14,15]. However the size of the a-skeletal actin genes in Fugu is unusual in this respect as the Fugu a-skeletal actin genes sizes are similar to the gene sizes in mammals and in the case of introns 2,3 and 5 the Fugu actins have significantly larger intron sizes than the mammalian equivalents.
4. Discussions & Conclusions
The problem of being able to identify a functional promoter element can be reduced if the putative regulatory motif identified is in context with the gene whose expression it is affecting. In this respect, Theatre fills a niche and can be employed to establish the relationships among these features. Comparative DNA sequence analysis can help to reveal conserved rules in equivalent gene systems which may have roles in the gene expresssion in early development and tissue specific differentiation and therefore play a role in the systematic and rational design of biochemical experiments to prove or disprove putative functions.
There are more sequence analysis tools that Theatre could be adapted to use, for example more gene prediction programs. Given this multiplicity of programs, another possibility is for Theatre to identify putative coding regions using a consensus of several gene prediction results. Presently we are working to produce two interactive versions of Theatre, one with a WWW interface using CGI standards and PERL scripts and the other using Java applications. The ultimate aim of Theatre is to make it as easy as possible to use by allowing the user to look at the results of different programs and varying selections of parameters and features for display so that the results can be taken in at a glance.
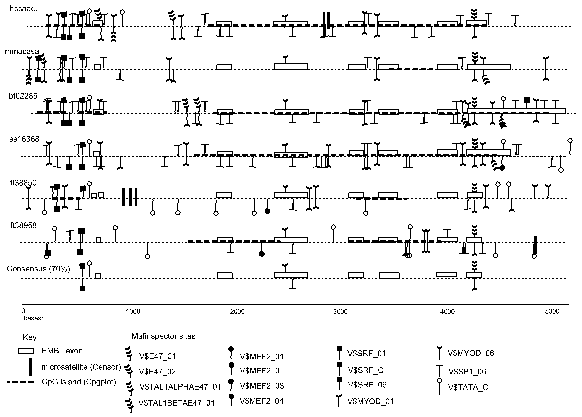
Figure 1. Concise Theatre display showing 6 a-skeletal actin aligned sequences, with the breaks indicating the gaps in the alignment. The features are shown above or below the line depending on whether they are on the direct or complement strand respectively (Please see section 3).
Acknowledgements
This work is financially supported by the EC TRAnscription Databases and Analysis Tools (TRADAT) project (Contract: BIO4-CT95-0226). We thank our colleagues at the UK HGMP RC and our TRADAT collaborators for useful discussions.
References
- D. G. Higgins, J. D. Thompson, & T. J. Gibson (1996). Using Clustal for multiple sequence alignments. Methods In Enzymology, 266: 383-402.
- G. Stoesser, M. A Moseley, J. Sleep, M. McGowan, M. Garcia-Pastor & P. Sterk (1998). The EMBL nucleotide sequence database. Nucleic Acid Research, 26:8-15.
- F. Altschul, W. Gish, W. Miller, E. W. Myers, & D. J. Lipman (1990). Basic local alignment search tool. J. Mol. Biol., 215:403-410.
- A. Bairoch & R. Apweiler (1997). The Swissprot protein sequence database the relevance to human molecular medical research. J. Mol. Med., 75:315-316.
- M. Borodovsky & J. Mcininch (1993). GENEMARK – Parallel gene recognition for both DNA strands. Comp. Chem., 17:123-133.
- A. Pavesi, F. Conterio, A., Bolchi, G. Dieci, S. Ottonello (1994). Identification of new eukaryotic transfer-RNA genes in genomic DNA databases by a multistep weight matrix analysis of transcriptional control regions. Nucleic Acids Research, 22:1247-1256.
- K. Frech, G. Herrmann & T. Werner. (1993). Computer-assisted prediction, classification, and delimitation of protein-binding sites in nucleic-acids. Nucleic Acids Research, 21:1655-1664.
- K. Quandt, K. Frech, H. Karas, E. Wingender & T. Werner (1995). Matind and Matinspector – New fast and versatile tools for detection of consensus matches in nucleotide-sequence data. Nucleic Acids Research, 23:4878-4884.
- D. S. Prestridge & G. Stormo (1993). Signal Scan 3.0 – New database and program features. Computer Applications In The Biosciences, 9:113-115.
- E. Wingender, A. E. Kel, O. V. Kel, H. Karas, T. Heinemeyer, P. Dietze, R. Knul, A. G. Romaschenko, & N. A. Kolchanov (1997). TRANSFAC, TRRD and COMPEL: Towards a federated database system on transcriptional regulation. Nucl. Acids Res., 25, 265-268.
- M. Gardiner-Garden & M. Frommer (1987). Cpg-Islands in vertebrate genomes. J. Mol. Biol. 196:261-282.
- J. Jurka, P. Klonowski, V. Dagman, & P. Pelton (1996). Censor – a program for identification and elimination of repetitive elements from DNA sequences. Comp. Chem. 20:119-121.
- B. Venkatesh, B. H. Tay, G. Elgar, & S. Brenner (1996). Isolation, characterization and evolution of 9 pufferfish (Fugu-rubripes) actin genes . J. Mol. Biol., 259:655-665.
- G. Elgar, R. Sandford, S. Aparicio, A. Macrae, B. Venkatesh, & S. Brenner (1996). Small is beautiful – comparative genomics with the pufferfish (Fugu rubripes). Trends in Genetics, 12:145-150.
- S. Brenner, G. Elgar, R. Sandford, A. Macrae, B. Venkatesh, & S. Aparicio. (1993). Characterization of the pufferfish ( Fugu) genome as a compact model vertebrate genome. Nature, 366:265-268.
- M. Frith, Y. J. K. Edwards, & M. J. Bishop (1997). Raising the curtain on Theatre: a new tool for the comparative investigation of functional features in DNA sequences. UK HGMP Resource Centre Genome News Winter 1997, pp. 15-17.