GORBAN A.N., POPOVA T.G.+, SADOVSKY M.G.
Institute of Computational Modelling of , Siberian Branch of the Russian Academy of Sciences, Akademgorodok, Krasnoyarsk-36, 660036, Russia;
e-mail: msad@cc.krascience.rssi.ru
+Corresponding author
Keywords: nucleotide sequences, frequency dictionaries, euclidian metrics, dynamic core, Ca-dependent proteins, ribosomal 16s RNA
Abstract
Classifications of nucleotide sequences obtained according to their frequency dictionaries are studied. Two sequences are considered to be close to each other, if their frequency dictionaries are close in Euclidean metrics. Division of sequences into classes was performed by the method of dynamic cores. A group of genes of Ca–dependent proteins and a group of the genes of ribosomal 16s RNA were studied. The correlation between structure (i.e. frequency dictionary) and function for the genes of Ca–dependent proteins as well as between structure and taxonomy for the genes of ribosomal 16s RNA is proven. This correlation means that the genes of Ca–dependent proteins obtained from different species belong to the same class, if their function is similar; that correlation increases when one considers the genes obtained from the species of the common taxon (mammalians, in our case). For the genes of ribosomal 16s RNA the correlation means that the genes of the same familia belong to the same class, and exceptions are rare. No obvious correlation has been observed for the classification developed for higher taxa of those genes.
1. Introduction
A relation between structure and function of biological macromolecules is a key issue of molecular biology and related areas of science. Currently, a tremendous amount of the decoded sequences is gathered; one could expect to prove the fact of relation between structure and function, in principle. Whether two (or several) genes with similar (or even the same) function have the structures of significant proximity — that is the exact question concerning the relation between structure and function of biological macromolecules. The answer depends strongly on the way a proximity of nucleotide sequences is defined. To analyse the interrelation between structure and function, an idea of proximity of structures of two (or more) nucleotide sequences is very important, rather than an idea of what is a structure itself. In this paper, two nucleotide sequences would be considered to be close each other, if their frequency dictionaries are close [1-3].
A nucleotide sequence considered as symbol sequence from four-letter alphabet we would call genetic text (GT). Any subsequence from the given GT (of the length q) would be called word. Only continuous sequences, i.e. with no gaps in them, would be studied, both as GT, and words. The Frequency dictionary (FD) of the length q is the set of the words of the length q occurred within the GT accomplished by their frequencies (how often they are encountered in the text) [1-3]. Here the frequencies of FD are normalized to 1.
If M is a cardinal number of an alphabet, then total number of all possible words of the length q is equal to Mq. Obviously, not every word could be met in a text, as words become long enough. Let extend the dictionary to the complete one by adding the words with zero frequency. Then any FD is represented as a point F(f1,f2,…,fMq) in Mq–dimensional space; frequencies fi: 0 <= fi<= 1, i=1,2,…, Mq are the values of the corresponding coordinates. This representation of frequency dictionaries yields an ensemble of points in Mq–dimensional space, for a set of sequences studied.
Everywhere below, two sequences would be considered to be close each other, if two points in Mq–dimensional space representing the dictionaries are close (in Euclidean metric). The study of distribution of the points in Mq–dimensional space allow us to characterize an ensemble of sequences; e.g., it will allow to split the sequences into classes, or prove impossibility of such splitting.
2. Method
In order to investigate a distribution of the points in Mq–dimesional space the algorithm of automatic classification was used. That is the algorithm of separation into classes without preliminary learning. We used the method of dynamic cores [4]. Consider a set {Fi}, i=1,2,…, L of L points; this set is to be separated into several classes. Let there exist an (arbitrary) initial splitting of the points into certain number of classes. For each k–th class the centre Ck(c1k,…,ckMq) is determined as
 , , |
(1) |
here lk is the number of points in this class. Then the distance from each point of the set to the centre of every class
|
(2) |
is calculated, and the attribution of the point to the class is revised. A point is presumed to belong to that class, for which it has the least distance to the centre. When all the points in the set are rearranged, the centres should be recalculated. This procedure runs until no one point changes its class attribution.
Further, class distinction condition is checked out. If all the new obtained classes differ, then the classification is over. If they don’t, then two closest classes should be merged into one, and the procedure runs again. The condition we used presumes two classes to be distinct, if a distance between the centres is greater than the maximal average radius of those two classes. An average radius of k–th class is defined as
|
(3) |
with djk determined according to (2); here index i runs all the points within the k–th class.
A classification performed due to the algorithm results in separation of the points into the maximal number of classes, which satisfy the distinction condition.
3. Objective
The group of genes studied exhibits two classifications, originally. The former is a natural taxonomic classification, the latter is the classification according to their functional properties. Besides, the third classification could be developed in this group, that is based on the statistical properties of the FDs of those genes. The main goal of our research is to answer the question whether this third classification shows a correlation to original two ones.
The genes of two types have been studied, separately. The first group included the mRNA sequences of Ca–dependent proteins of various functions, obtained from a range of organisms. These proteins are rather ancient biological entities with quite similar functions in organisms of various taxa. One should expect to observe a significant respond in relation between structure and function. These sequences have been retrieved from Sagittarius bank and from NCBI–bank (release 94).
The sequences of genes of ribosomal 16s RNA of various bacteria constituted the second group. We consider strictly one functional group of genes in order to eliminate the difference in function and investigate the interrelation of statistical structure of nucleotide sequences and their taxonomy. All the sequences of the second group were retrieved from EMBL–bank (ftp://ccrv.obs-vlfr.fr/pub/christen/16s).
4. Results
I. Ca–dependent proteins
Here we present the results of determination of relation between structure of nucleotide sequences and the function of the genes encoded by those sequences for the family of Ca–dependent proteins.
Total number of sequences studied is 598. The group occurred to be quite inhomogeneous according to sequence taxonomy: the numbers of sequences in various taxa differ strongly (mammalians are about 58 % of the total number of sequences). The list of proteins encoded by the genes studied is rather wide and diverse. It consists of Ca–binding proteins (27 % of total number of genes studied), genes of calcium channels (12 %), calmodulines (10 %) and others.
Dimension of space for the lengths 1, 2, 3 and 4 is 4, 16, 64 and 256, respectively. The number of points to be classified are to exceed significantly the space dimension. This constraint makes classification for the length 4 doubtful. The classification of points representing FDs of the length 1 and 2 seems to be of no interest, since at these lengths the structure of a nucleotide sequence is poorly presented. On the contrary, a FD of the length 3 represents wide spectrum of structures of nucleotide sequence; at least one of them, i.e. the codon structure, is represented entirely in it. One should expect that the classification developed over the FDs of the length 3 reveals the relation between structure and function, as well as between structure and taxonomy of genes.
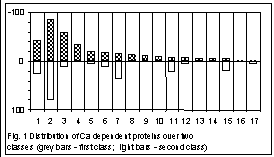
Figs. 1 and 2 show the classification obtained at the length 3. The sequences have been splitted into two classes. The distance between the centres of classes is equal to 0.059, while the average radii of the classes are 0.0526 and 0.0539, respectively. Fig. 1 shows a distribution of all the Ca–dependent proteins studied over two classes, within each functional group. Attribution of a sequence to certain functional group was performed due to the description of the sequence. As one can see, there are genes falling into a class with no respect to the taxonomy of their host organism but according to their functionality. Such unambiguous separation occurs not always; in a majority of groups, the genes of the same functional group are split into two classes while the distribution is obviously biased (Appendics 1 contains functional groups numbered in Fig.1).
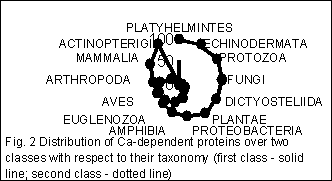
Quite remarkable pattern occurs for the distribution of various taxa over these two classes determined through the statistical properties of FDs. Fig. 2 shows the distribution of genes from a taxonomy group over two classes. The number of sequences (arranged in percent) in every class is presented for each taxonomic group here.


When splitting the group of nucleotide sequences into classes according to their statistical structure, every sequence gets into some class due to two competitive reasons. The first is dictated by taxonomical proximity of the host organisms, the second one – by functional proximity of proteins encoded by genes studied. It results in phenomenon we have observed in figures 1 and 2: if functional proximity effect is significant then genes of distantly related taxonomic groups get into one class; on the other hand if taxonomical proximity effect is strong then genes encoded functionally distinct proteins get into one class.
Classification of the genes of one taxonomic group – mammalians – shows more clear separation with respect to function of protein. It means that total amount of protein species which genes etirely fall into one class became more than it was for all genes. This fact reveals the interrelation between structure and function quiet clear.
II. 16s RNA

A correspondence between the taxonomy of organisms and the structure of their genes could be seen from a set of genes of exactly the same function. We have used a set of the genes of ribosomal 16s RNA of various bacteria to study this correlation. Total number of the sequences available is 1731. To start the classification, we have split the sequences of 16s RNA into 10 classes. No classification has been obtained for the length 4; a reliable classification has been obtained for the lengths 2 and 3. The classification obtained at the length 3 is of the greatest interest.
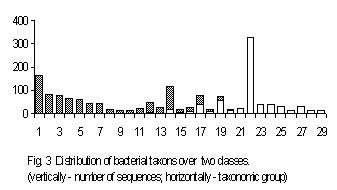
The sequences separated into two classes. Fig. 3 shows this classification. The groups of sequences displayed in Fig. 3 are arranged according to the classical taxonomy provided in the files’ description (Appendics 2 contains taxonomical groups numbered in Fig.3). The classification developed contains two classes; the sequences from the first class are shown by light-grey bars, while the sequences from the second class are shown by black ones. Several taxonomic groups contain the sequences belonging to different classes, while all other groups fell into a single class, entirely. One can see various taxonomic familias tending to get into one specific class. An attempt to look through classification for more general taxonomic groups leads to entirely stochastic separating with respect to these taxonomic groups. This situation seems to us to be explicable. This is because it was the set of bacterial genes that processed here. It is well known that bacterial taxonomy differs from plants and higher animals one: bacterial higher taxon concept is rather artificial. Newly obtained molecular-biological data make one to revise the higher taxon structure and belonging of some familias to higher taxons as well. To investigate statistical classificasion of various sets of genes seems to us very importatnt in creating complete and consistent taxonomy.
5. Conclusion
We have investigated the interrelation between function encoded in nucleotide sequence, taxonomy of the host organism and statistical structure of GT. To be more precise the question was: How much would the statistical structure correlate with protein function and taxonomy. We have used FD of nucleotide sequence to represent its statistical structure.
The set of genes of Ca–dependent proteins exhibits a relation between a function encoded in a sequence, and a structure of that latter. Correspondence between statistical structure and function become evidence for some functional protein groups. Some correlation between structure and taxonomy were revealed too.
Automatic classification of bacterial genes 16s RNA have allowed us to enfer that strong correlation exists between statistical structure and taxonomy. So randomless distribution of various taxonomic groups over two classes makes it convincing.
The classification presented in this paper is still waiting to be investigate more precise and to explane its biological meaning.
Acknowledgements
This work was partly supported by the Krasnoyarsk Regional Science Foundation (grant 7F0012).
References
- A.N.Gorban, E.M.Mirkes, T.G.Popova, M.G.Sadovsky, “A new approach to study the statistical properties of genetic sequences” /Biofizika (1993), vol.38, # 5, p.762 – 767.
- E.M.Mirkes, T.G.Popova, M.G.Sadovsky, “Investigating Statistical Properties of Genetic Texts: A New Approach”/Advances in Modelling & Analysis, ser.B, AMSE Press, (1993) vol.27, # 2, p.1-13.
- T.G.Popova, M.G.Sadovsky, “The new measure of relationship between two symbolic sequences”//Advances in Modelling & Analysis, ser.A, (1994) AMSE Press. vol.22, # 2, p.13 – 17.
- Gorban A.N., Rossiev D.A. “Neural networks on PC” Novosibirsk, Nauka; 1996; 275 p.
Appendics 1. Functional groups for Fig. 1
1. Others; 2. Calcium binding protein; 3. Calcium channel; 4. Calcitonin; 5. Calcium atpase; 6. Calcium calmodulin dependent protein kinase; 7. Calmodulin; 8. Calcitonin gene related peptid; 9. Calcium activated potashium channel; 10. Osteocalcin; 11. Calcineurin; 12. Calcium dependent protein; 13. Sodium calcium exchanger; 14. Calcium sensing receptors; 15. Calcium dependent protein kinase; 16. Calcium transport atpase; 17. Calcium response protein.
Appendics 2. Taxonomical groups for Fig. 3
The highest taxon for all species – Eubacteria; “F” – Firmicutes; “P” – Proteobacteria.
- F; Actinomycetes; Clavibacter; 2. F; Actinomycetes; Pseudonocardiaceae; 3. F; Actinomycetes; Aureobacterium; 4. P; gamma subdivision; Pasteurellaceae; 5. F; Actinomycetes; Propionibacteriaceae; 6. P; epsilon subdivision; 7. P; alpha subdivision; Rickettsiales; 8. P; gamma subdivision; Vibrionaceae; 9. F; Actinomycetes; Renibacterium; 10. P; gamma subdivision; Moraxellaceae; 11. P; gamma subdivision; Legionellaceae; 12. Spirochaetales; 13. P; gamma subdivision; Enterobacteriaceae; 14. Cytophagales; 15. P; gamma subdivision; Methylococcaceae; 16. P; delta subdivision; Sulfate-redusing or sulfur-reducing dissimilatory bacteria; 17. P; alpha subdivision; Bradyrhizobium; 18. environmental samples; 19. P; alpha subdivision; Rhizobiaceae; 20. P; alpha subdivision; Methylobacterium; 21. P; alpha subdivision; Rhodobium + Rhodomicrobium + Rhodospirillace; 22. F; Low G+C gram-positive bacteria; 23. P; alpha subdivision; Acetobacteraceae; 24. F; Actinomycetes; Streptomycetes; 25. F; Actinomycetes; Streptosporangiaceae; 26. Fibrobacter; 27. Chloroflexaceae/Deinococcaceae group; 28. P; gamma subdivision; Aeromonas; 29. P; delta subdivision; Myxobacteria;
