Ceres Inc, 3007 Malibu Canyon, Malibu ; CA 90265, USA;
email: nicka@ceres-inc.com;
1Kyoto University, Kyoto 606, Japan;
email: go@qchem.kuchem.kyoto-u.ac.jp;
+Corresponding author
Keywords: gene families, protein sequences, Zipf law
Fast progress in structural molecular biology dictates an updated revision of the estimated number of protein families in nature. Such estimations clarify an effectiveness of the fold recognition technique, answering a question what fraction of proteins can be predicted by threading or sequence similarity methods.
Previous attempts to deduce a number of protein families varies significantly from 500 to about 8000 (Chothia, 1992; Alexandrov & Go, 1994; Orengo et al., 1994; Wang, 1996; Zhang, 1997). Here we revise these calculations using the updated datasets of protein sequences and 3D structures and the corrected shape of the distribution of proteins among structural families.
The first estimate of the number of protein families has been explicitly done by Chothia in 1992. At that time about 120 structural families were known. Chothia summarized the results of several genome projects and revealed that the chances of a random protein to belong to one of the known sequence families is approximately 1/3. According to the results of sequence comparison of the PDB with sequence databases (Sander, Schneider 1991), about 1/4 of all sequences appeared to be similar to one of the PDB entries at 25% identity level. Assuming equal distribution of proteins among the families, Chothia concluded that the total number of protein structural families should be equal to 120*3*4 = 1440.
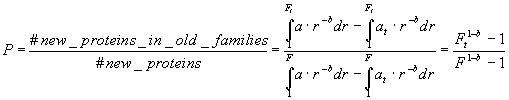
Analysis of the present classification of protein sequences and structures shows that some families contain more proteins that others. Distribution of proteins among families can be very precisely approximated by Zipf’s law (Zipf, 1949). Let us see how this can change the estimated number of protein families. In our calculations we use data from Pfam — a sequence-based classification of proteins (Sonnhammer et al., 1997) and from structural classification, SCOP (Murzin et al., 1995). Both Pfam and SCOP classifications are based on the domain resemblance.
Pfam-2.1 database consists of 101,724 domains of proteins from SwissProt (Bairoch & R., 1996) release 34, clustered in 13,816 families. There were also 7,694 proteins of 30 or more amino acids in SwissProt-34, which are not present in Pfam and are not similar to other proteins. We have added them into the database, which now contains 109,418 domains in 21,510 families. We have eliminated very similar sequences from the database, trying to make the database more homogeneous. In the final classification there were 60,601 domains, distributed within 21,510 families. All families were ranked by the number of domains in each family. The resulting distribution is presented in Figure 1. This distribution fits nicely to the Zipf’s law:
![]() (1)
(1)
where r is the rank of family, n(r) is a number of proteins in the r-th family, a is a scaling constant, depending on the number of proteins in the dataset, and b ![]() 0.64. Constant b does not depend on the size of the dataset.
0.64. Constant b does not depend on the size of the dataset.
Let us consider several properties of this distribution. The largest rank of the family, with at least one member, obviously equals to the total number of families, F:
![]() (2)
(2)
The number of proteins and the number of families are related by the following formula:
![]() (3)
(3)
This dependence between F and N should be carried out for random subsets of proteins. To check this, we have generated chronologically several subsets of the current Pfam, including only proteins known before the specific date.
Suppose now that we have a set of Nt proteins, which are grouped in Ft families. The probability of a random new protein to belong to one of these families is:
 (4)
(4)
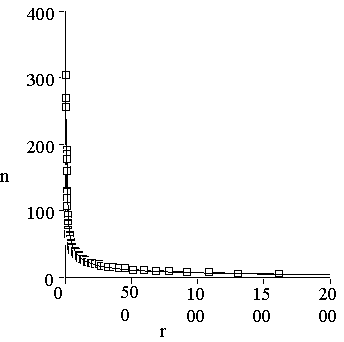
Figure 1. Distribution of protein sequences among protein families. One can see that the distribution is essentially non-equal. The shape of the distribution is described very well by Zipf’s law: n(r) = ar-b, with a= 640 and b=0.64. Correlation coefficient of this approximation equals to 0.992.
We can compute P by selecting a set of known proteins by a certain date t, and counting a fraction of new proteins falling into the known classes. From equation (4), the total number of families can be computed as:
 (5)
(5)
Results of calculations are presented in Figure 2. The total number of sequence families thus appeared to be about 60,000.
Some sequence families can be united into common 3D folds. We took a representative of each sequence family in the PDB and made similar estimates as we did for sequence families. The distribution of proteins among structural families obeys Zipf’s law with parameter b = 0.8 very well. We know that the total number of family representatives should be about 60,000. Formula (3) with N = 60,000 and b = 0.8 results in the total number of different folds F = 14,000. Calculations of the number of structural families based on the probabilities of a new structure to belong to one of the previously known folds (formula 5), results into a surprisingly low number of protein families of about 700 (Figure 3). This difference we explain by biased nature of the PDB, representing mostly proteins which can be crystallized and are biologically interesting.
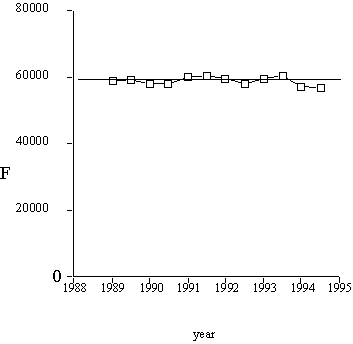
Figure 2. The total number of sequence families, computed with formula (5).

Figure 3. The total number of structural families computed with formula (5).
An important feature of Zipf distribution is that it has a very long tail of clusters with only few members in it. For example, if b=0.7, half of all proteins is located in 10% of all clusters.
A significant portion (more than a half) of all families contain only one protein. Such a big number of single-protein families is a serious limitation to the homology-based approach to protein structure prediction.
References
- Alexandrov NN & Go N. 1994. Biological meaning, statistical significance, and classification of local spatial similarities in nonhomologous proteins. Protein Sci. 3:866-875.
- Bairoch A & R. A. 1996. The SWISS-PROT protein sequence data bank and its new supplement TREMBL. Nucleic Acids Res. 24:21-25.
- Chothia C. 1992. One thousand families for the molecular biologist. Nature 357:543-544.
- Murzin AG, Brenner SE, Hubbard T & Chothia C. 1995. scop: a structural classification of proteins database for the investigation of sequences and structures. Journal of Molecular Biology 247:536-540.
- Orengo CA, Jones DT & Thornton JM. 1994. Protein superfamilies and domain superfolds. Nature 372:631-634.
- Sander C & Schneider 1991. Database of homology-derived protein structures and the structural meaning of sequence alignment. Proteins 9(1):56-68.
- Sonnhammer ELL, Eddy SR & Durbin R. 1997. Pfam: a comprehensive database of protein domain families based on seed alignments. Proteins 28:405-420.
- Wang Z-X. 1996. How many fold types of protein are there in nature? Proteins 26:186-191.
- Zhang C-T. 1997. Relations of the numbers of protein sequences, families and folds. Protein Engineering 10(7):757-761.
- Zipf GK. 1949. Human behavior and the principle of least effort, Addison-Wesley, Cambridge, Massachusetts.