PONOMARENKO M.P.+, KOLCHANOV N.A., SHINDYALOV I.1, BOURNE P.1
Institute of Cytology and Genetics, Siberian Branch of the Russian Academy of Sciences, 10 Lavrentiev Ave., Novosibirsk, 630090, Russia;
1San Diego Supercomputer Center, San Diego, CA 92186-9784, USA
+Corresponding author
Keywords: proteins, protein conformation, similarity, structure alignment, stochastic geometry, fuzzy logic, utility theory, decision making
Abstract
A method for estimation of similarity in protein conformations based on stochastic geometry, fuzzy logic, and the utility theory for decision making is proposed. This method was used to create a system LIKENESS designed to search for and align similar protein conformations from PDB. The system LIKENESS is shown to solve these problems under real-time mode. The system is accessible at http://cl.sdsc.edu/.
Introduction
The databank PDB is the source of information on 3D structures of proteins [1]. Search for and alignment of similar protein conformations are typical problems of its analysis [2]. The methods that have been so far proposed for this aim [2-12] are so time-consuming that specialized databanks, such as FSSP [12], DALI [8], CATH [13, 14], SSAP [15], and Entrez/3D [16] are developed to store the results obtained. We propose a method for estimation of protein conformation similarity that is based on stochastic geometry [17], fuzzy logic [18], and the utility theory for decision making [19]. The method allows similar protein conformations to be searched for in PDB [1] and aligned under real-time mode.
Materials and methods
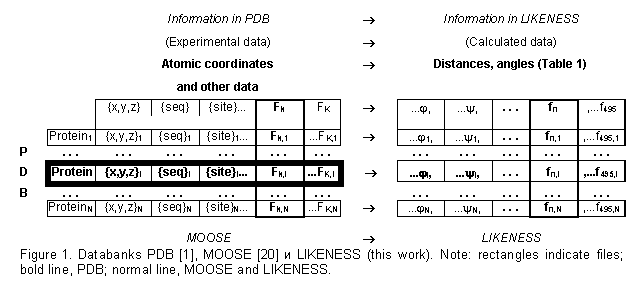
The databank MOOSE [20-22] was used in the work (Fig. 1; an object-oriented PDB [1] where the data are systematized according to the protein structural patterns). We supplemented MOOSE [20] with the structural properties that are calculated from atomic coordinates (Table 1): accessible surface and polarity [23], secondary structure [24], ![]() – and
– and ![]() -angles [25-28], the distances and angles (Fig. 2) between
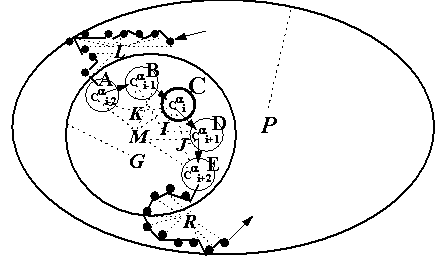
-angles [25-28], the distances and angles (Fig. 2) between ![]() atom of a given residue and the neighboring
atom of a given residue and the neighboring ![]() atoms or between the centers of mass of various protein fragments (totally 495 properties). The values of these properties for each residue of each protein have been calculated and are stored in the database LIKENESS (http://cl.sdsc.edu/).
atoms or between the centers of mass of various protein fragments (totally 495 properties). The values of these properties for each residue of each protein have been calculated and are stored in the database LIKENESS (http://cl.sdsc.edu/).
The method proposed is designed to estimate the similarity of conformation of arbitrary proteins S and T. If these proteins had an “![]() /
/![]() ” folding, the distances between the
” folding, the distances between the ![]() atoms of their (i-2)th and (i+2)th residues (distance AE in Table 1) would be important for estimation of their similarity; for “
atoms of their (i-2)th and (i+2)th residues (distance AE in Table 1) would be important for estimation of their similarity; for “![]() /
/![]() ” folding, the distances between the
” folding, the distances between the ![]() of their (i-1)th and (i+1)th residues (distance BD in Table 1). However, such information is lacking for arbitrary proteins S and T. On the whole, additional information is lacking for the procedures decreasing dimensionality of the methods for data analysis in similarity estimation of any arbitrary proteins. That is why our method is based on the following idea: when the proteins S and T are similar, the majority of their properties {fn} is approximately similar {fn(S)
of their (i-1)th and (i+1)th residues (distance BD in Table 1). However, such information is lacking for arbitrary proteins S and T. On the whole, additional information is lacking for the procedures decreasing dimensionality of the methods for data analysis in similarity estimation of any arbitrary proteins. That is why our method is based on the following idea: when the proteins S and T are similar, the majority of their properties {fn} is approximately similar {fn(S) ![]() fn(T)}. Since the accuracy of such estimation increases with the number of the conformational properties involved, we take into consideration as many properties as our computer (Alpha, Digital Equipment Corporation) allows.
fn(T)}. Since the accuracy of such estimation increases with the number of the conformational properties involved, we take into consideration as many properties as our computer (Alpha, Digital Equipment Corporation) allows.
Let’s consider the proteins S and T and a set of N properties of their conformation {fn} (where 1<= n<= N<=495). The matrix of similarity of their conformations characterizes their residues si and tj at positions i and j in terms of equality of the values {fn(si) ![]() fn(tj)} of {fn} properties. Then the estimation of similarity of the residue codes is as follows:
fn(tj)} of {fn} properties. Then the estimation of similarity of the residue codes is as follows:
 (1)
(1)
where PAM (x;y) is the similarity of the residues x and y for the alignment of protein sequences [25].
Similarity of the secondary structures fn(si) and fn(ti) in the Kabash-Sander alphabet {h, g, t, i, b, e, s, ![]() } [24] is:
} [24] is:
 (2)
(2)
Similarity of the conformations in their quantitative properties fn(si) and fn(ti) {fn(si) ![]() fn(tj)} with the range of values Range(fn) is estimated in a “null” approximation, when any fn values are considered equally probable. In this case, the hypothesis {H0: fn(si)=fn(tj)} is tested using the following equation [29]:
fn(tj)} with the range of values Range(fn) is estimated in a “null” approximation, when any fn values are considered equally probable. In this case, the hypothesis {H0: fn(si)=fn(tj)} is tested using the following equation [29]:
![]() . (3)
. (3)
This significance level ![]() n is transformed into similarity estimation by the following equation:
n is transformed into similarity estimation by the following equation:
 (4)
(4)
The particular values of similarity estimations (equations 1-4) are used to calculate the integral estimation:
 . (5)
. (5)
Application of equations (1-5) to each pair of residues si and tj of the proteins S and T gives the matrix {U(si;tj)} (Fig. 3), which has the two following interpretations:
(#) IF {U(si;tj)<0}, THEN {the residues si and tj dissimilar};
($) IF {U(si;tj)>U(si;tk)>0}, THEN {the conformation of the residue si is more similar to the conformation of tj, than of tk.}.
This interpretation coincides with the maximization of Needleman-Wunsch similarity [30] for sequence aligning. Thus, LIKENESS aligns the sequences of Ca atoms and then matches it with the minimum of root-mean-square deviation RMSD [31]. For the same reason, the similarity of the fragments {si,…,si+![]() -1} and {tj,…,tj+
-1} and {tj,…,tj+![]() -1} of length D of the proteins S and T is estimated by the equation:
-1} of length D of the proteins S and T is estimated by the equation:
 . (6)
. (6)
While searching PDB for the proteins similar to the fragment {si,…,si+![]() -1} of the protein S, LIKENESS excludes the proteins lacking such similarity (interpretation #) and reveals one most similar fragment in each of the rest proteins (interpretation &).
-1} of the protein S, LIKENESS excludes the proteins lacking such similarity (interpretation #) and reveals one most similar fragment in each of the rest proteins (interpretation &).
LIKENESS is realized in C++, installed at the San-Diego Supercomputer Center (USA), and is available at “http://cl.sdsc.edu/”. Note that we adopted the description of geometrical objects with the help of hypothesis on “equality of their values of the same type” from stochastic geometry [17]; the qualitative similarity estimation, from Zadeh’s fuzzy logic [18]; and averaging of particular estimations into the integral estimation, from the utility theory for decision making [19].
Results and discussion
Let’s use the example of ![]() – and
– and ![]() -hemoglobins [33] to describe the operation of LIKENESS. Dark cells in the similarity matrix of
-hemoglobins [33] to describe the operation of LIKENESS. Dark cells in the similarity matrix of ![]() – and
– and ![]() -hemoglobins (Fig. 3a) indicate similarity; light cells, dissimilarity; the optimal route of alignment lies along the main diagonals of the matrix with a transition between them, indicated by arrow. This transition means a deletion in
-hemoglobins (Fig. 3a) indicate similarity; light cells, dissimilarity; the optimal route of alignment lies along the main diagonals of the matrix with a transition between them, indicated by arrow. This transition means a deletion in ![]() -hemoglobin compared with
-hemoglobin compared with ![]() -hemoglobin. The
-hemoglobin. The ![]() atoms of
atoms of ![]() – and
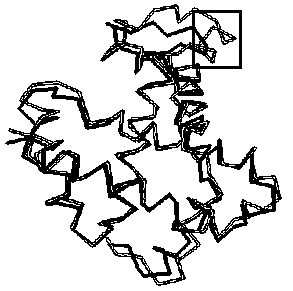
– and ![]() -hemoglobins are matched with rmsd=2.75Â and visualized with the program RASMOL [32] (Fig. 3b). Note that LIKENESS detected the helix D’ (framed), which is the major distinction between these hemoglobins.
-hemoglobins are matched with rmsd=2.75Â and visualized with the program RASMOL [32] (Fig. 3b). Note that LIKENESS detected the helix D’ (framed), which is the major distinction between these hemoglobins.
LIKENESS was used to search for the proteins similar to the Greek key between positions 28 and 73 of prealbumin: four ![]() -turns and three
-turns and three ![]() -turns [34, 35]. Greek keys 25 to 124 residues long occur in
-turns [34, 35]. Greek keys 25 to 124 residues long occur in ![]() /
/![]() -domains and
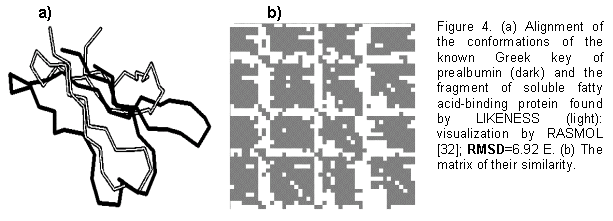
-domains and ![]() -barrels [35, 36]. We succeeded in finding in PDB [1] 41 fragments: the initial Greek key of prealbumin and its homologs, the Greek key of concanavalin A and its homologs, the Greek key of lectin and its homologs, and a fragment of soluble fatty acid-binding protein, lacking the recorded occurrence of Greek keys [35-38]. Shown in Fig. 4 are (a) alignment, performed by LIKENESS, of the this discovered fragment (light) with the initial Greek key of prealbumin (dark) and (b) their similarity matrix, where the dark cells indicate the similarity of
-barrels [35, 36]. We succeeded in finding in PDB [1] 41 fragments: the initial Greek key of prealbumin and its homologs, the Greek key of concanavalin A and its homologs, the Greek key of lectin and its homologs, and a fragment of soluble fatty acid-binding protein, lacking the recorded occurrence of Greek keys [35-38]. Shown in Fig. 4 are (a) alignment, performed by LIKENESS, of the this discovered fragment (light) with the initial Greek key of prealbumin (dark) and (b) their similarity matrix, where the dark cells indicate the similarity of ![]() -strands. Thus, LIKENESS has successfully found the similarity of the known Greek keys of prealbumin, concanavalin A, and lectin and a fragment of soluble fatty acid-binding protein with a similar arrangement of
-strands. Thus, LIKENESS has successfully found the similarity of the known Greek keys of prealbumin, concanavalin A, and lectin and a fragment of soluble fatty acid-binding protein with a similar arrangement of ![]() -strands and
-strands and ![]() -turns.
-turns.
Since LIKENESS is able to find successfully the similarity of arbitrary proteins, the possibility exists to modify this system for ![]() /
/![]() -,
-, ![]() /
/![]() -,
-, ![]() /
/![]() -domains,
-domains, ![]() -barrels, and Greek keys: involvement of the available data on these local protein conformations will increase the accuracy and speed of LIKENESS operation.
-barrels, and Greek keys: involvement of the available data on these local protein conformations will increase the accuracy and speed of LIKENESS operation.
Acknowledgements
The work was supported by the Russian Foundation for Basic Research (grants Nos. 97-04-49740, 97-07-90309, and 98-07-90126), Russian National Program on Human Genome, by grants Nos. IGSORAN 97/13, BIR-9507625, and ASC 8902825, and through donation of computers Digital Equipment Corp.
References
- Bernstein F.C. et al. // J. Mol. Biol., 1977, V. 112, P. 535.
- Holm L., Sander C. // Proteins, 1994, V. 19, P. 165.
- Taylor W.R., Orengo C.A. // J. Mol. Biol., 1989, V.208, P.1.
- Seto Y., Ikeuchi Y., Kanehisa M. // Proteins, 1990, V. 8, P. 341.
- Nussinov R., Wolfson H. // Proc. Natl. Acad. Sci. USA, 1991, V. 88, P.10495.
- Godzik A., Skolnik J., Kolinski A. // Protein Engineering, 1993, V. 6, P. 801.
- Zang K., Eisengberg D. // Protein Sci., 1994, V. 3, P. 687.
- Holm L., Sander C. // Trends Biochem. Sci., 1995, V. 20, P. 478.
- Mizuguchi K., Go N. // Protein Engineering, 1995, V. 8, P. 353.
- Hoffman D.L., Laiter S., Singh R.K. et al. // CABIOS, 1995, V. 11, P. 675.
- Madej T., Gibrat J.-F., Bryan S.H. // Proteins, 1995, V. 23, P. 356.
- Holm L., Sander C. // Nucl. Acids Res., 1996, V. 24, P. 206.
- Orengo C., Taylor W. // J. Mol. Biol., 1993, V. 233, P. 488.
- Orengo C., Flores T., Taylor W., Thornton J. // Protein Engineering, 1993, V. 6, P. 485.
- Taylor W., Flores T., Orengo C. // Protein Sci., 1994, V. 3, P. 1858.
- Hogue C.W.V., Ohkawa H., Bryan S.H. // Trends Biochem. Sci., 1996, V. 21, P. 226.
- N.G. Fedotov, “Methods of stochastic geometry in image recognition” (Moscow, Radio i Svyaz’, 1990).
- Zadeh, L.A. // Information and Control, 1965, V. 8, P. 338.
- Fishburn P.C. Utility theory for decision making, NY: John Wiley & Sons, 1970.
- Shindyalov I.N. and Bourne P.E. // CABIOS, 1997, In Press.
- Shindyalov I.N., Bourne P.E. // J. App. Cryst. 1995, V. 28, P. 847.
- Bourne P.E., Shindyalov I.N. // Acta Cryst., 1996, Sup., P. 78.
- Lee B., Richards F.M. // J. Mol. Biol, 1971, V. 55, P. 379.
- Kabsh W., Sander C. // Biopolymers, 1983, V. 22, P. 2577.
- Dayhoff M.O. et al. // Atlas of protein sequence and structure, 1979, V. 5, Suppl., P. 345.
- Bogardt R.A. et al. // J. Mol. Evol., 1980, V. 15, P. 197.
- G. Schulz and R. Schirmer, “Principles of protein structural organization” (Moscow, Mir, 1982).
- Chou P.Y., Fasman G.D. // Biochemistry, 1974, V. 13, P. 211.
- E. Lemna, “Testing of statistical hypotheses” (Moscow, Nauka, 1979).
- Needleman S.B., Wunsch C.D. // J. Mol. Biol., 1970, V. 48, P. 443.
- Hendrickson W.A. // Acta Cryst., 1979, Ser. A, V. 35, P. 158.
- Sayle R.A., and Milner-White E. J. // Trends in Biochem. Sci., 1995, V. 20, P. 374.
- Fermi G., Perutz M.F., Shaanan B., Fourme R. // J. Mol. Biol., 1984, V. 175, P. 159.
- Blake C., Geisow M., Oatley S., Rerat B., Rerat C. // J. Mol. Biol., 1978, V. 121, P. 339.
- Hutchinson E.G., Thornton J.M.// Protein Engineering, 1993, V. 6, P. 233.
- Orengo C.A., Flores T.P., Taylor W.R., Thornton J.M. // Protein Engineering, 1993, V. 6, P. 485.
- Sacchettini J.C., Gordon J.I., Banszak L.J. // J. Mol. Biol., 1989, V. 208, P. 327.
- Scapin G., Gordon J.I., Sacchettini J.C. // J. Biol. Chem., 1992, V. 267, P. 4253.
Table 1. Examples of protein conformation properties used in the work


