VALUEV V.P., KUROPATOV D.A., PONOMARENKO M.P.
Institute of Cytology and Genetics, Siberian Branch of the Russian Academy of Sciences, 10 Lavrentiev Ave., Novosibirsk, 630090, Russia; e-mail: valuev@bionet.nsc.ru
+Corresponding author
Keywords: amino acid sequence, functional site, zinc finger, recognition program generation
An integrated approach to recognition of given functional sites in an arbitrary amino acid sequence is suggested. In combines a number of independent recognition methods (such as, consensus, weight matrix, the linear Fisher discriminant, and perceptron). Different methods are optimal in each particular case, and our approach allows the user to either select or apply them simultaneously. The system for automatic generation of the programs using these methods has been developed. Its potential is illustrated by an example of DNA-binding motif of C2H2 zinc-finger type.
1. Introduction
Recognition of the elements of protein secondary and tertiary structures is one of the key points in prediction of their properties. Different methods of the image recognition theory [1] have been repeatedly applied to recognition of various sites in DNA and proteins. Among most widely used methods are neural networks [2], consensus [3-7], and perceptron algorithm [8, 9]. Recent studies demonstrate that, on the one hand, a sufficiently high prediction accuracy has been achieved, but on the other, implementation of only one method could not provide a considerable increase in the accuracy[1]. We are attempting to develop an integrated approach for predicting the elements of the protein tertiary structure. This approach combines various recognition methods[10, 11]. Basing on the
methods of consensus, weight matrix, linear Fisher discriminant, and perceptron algorithm, we have developed five programs for automatic generation of the C-code programs for recognition of each given site. This system was applied to recognize the C2H2 zinc-finger motif.
2. Methods
2.1. Basic idea
The programs that use an input training set for generation of the corresponding program recognizing certain motif or site were created for each of the above-mentioned methods. The current release uses the methods of consensus, weight matrix, perceptron algorithm, and the linear Fisher discriminant. All programs were developed in C. Sets of positive and negative examples (training sets) are used as input data. To obtain the correct result, all the sequences in both sets should be of equal lengths. The sequences that belong to a definite site are used as a positive example. The contents of the negative set are determined by the method applied and the task to be fulfilled. In any case, a set of random amino acid sequences can be used as a negative example. The sets obtained from the positive set through arbitrary rearrangement of the amino acid residues can be used as a negative set in case of weight matrix, linear Fisher discriminant, and perceptron algorithm. For the two last methods, the negative set can be additionally formed of the sequences of another site. The only condition for the sequences of the negative set is that they do not belong to the positive set. The result of these program operation is other C codes that recognize the regions in question in an arbitrary amino acid sequence through matching to each position the value of the weight function of the region starting from this position. The program developed is available for free use at http://wwwmgs.bionet.nsc.ru/Programs.
2.2. Consensus
Consensus is a sequence of the amino acid residues (or nucleotides, in case of DNA) most frequently occurring at each position. From physical standpoint, building consensus corresponds to a key-and-lock model. There are different approaches to creation of consensus sequence: one or several residues can be assigned to each position and considered with different weights. We applied the following algorithm to build the consensus [3]. The informational significance of each position was calculated as:
![]() (1)
(1)
where i is the number of position; r, amino acid residue; and ![]() , frequency of occurrence of the rth residue at the ith position. This value was used to calculate the value
, frequency of occurrence of the rth residue at the ith position. This value was used to calculate the value ![]() . If the latter value exceeds the universal threshold T, the residue r was included into the consensus at position r. Thus, we did not limited the number of residues assigned to each position and did not assign different weights to them. The value T was calculated by similar algorithm over the set of random sequences:
. If the latter value exceeds the universal threshold T, the residue r was included into the consensus at position r. Thus, we did not limited the number of residues assigned to each position and did not assign different weights to them. The value T was calculated by similar algorithm over the set of random sequences:
|
(2) |
Discriminating function was calculated as:
![]() (3)
(3)
where ![]() and
and ![]() are the numbers of matches and mismatches with the consensus sequence, respectively.
are the numbers of matches and mismatches with the consensus sequence, respectively.
Thus, the value of the weight function falls within the range of -L to L, where L is the length of the sequence. If W>0, the sequence analyzed is considered to belong to the positive set; otherwise, to negative set.
2.3. Weight matrix
The physical basis for the weight matrix model is Berg-von Hippel statistical mechanics [10]. A weight matrix is a matrix of size L? 20, where L is the sequence length. Values of the matrix elements ![]() are calculated according to the equation:
are calculated according to the equation:
![]() (4)
(4)
where ![]() is the number of site variants in which residue r occurs in position i; 20, number of variants of amino acid sequences in each position; N, number of sequences in the positive set; and 1 and 20 correspond to the Bayesian probability 1/20. The value of discriminating function is calculated according to the equation:
is the number of site variants in which residue r occurs in position i; 20, number of variants of amino acid sequences in each position; N, number of sequences in the positive set; and 1 and 20 correspond to the Bayesian probability 1/20. The value of discriminating function is calculated according to the equation:
![]() (5)
(5)
where ![]() is the element of the weight matrix corresponding to the residue r in position i, if this residue occurs in this position in the sequence analyzed; W0=
is the element of the weight matrix corresponding to the residue r in position i, if this residue occurs in this position in the sequence analyzed; W0=![]() (W++W–), where W+=
(W++W–), where W+=![]() is the mean value of the weight function over the positive set; W–, the mean value of the weight function over the negative set. The values of the weight function fall in the range of -L to L; the threshold value is 0.
is the mean value of the weight function over the positive set; W–, the mean value of the weight function over the negative set. The values of the weight function fall in the range of -L to L; the threshold value is 0.
2.4. Linear Fisher discriminant
The linear Fisher discriminant is a linear discriminating function ![]() in the space of properties, for which the criterion function
in the space of properties, for which the criterion function  is maximal (m1 and m2 are the values of discriminating function for the means of two classes
 ![]() ,
, ![]() ;
;![]() , dispersion within the classes) [11]. This describes the physical model of limiting stages.
, dispersion within the classes) [11]. This describes the physical model of limiting stages.
We used the relative content of each residue in the sequence as a property. Thus, we had a 20-dimensional space of properties. The resulting function was normalized as follows: if the value of ![]() was located on the same side as mno relative to myes, than the function
was located on the same side as mno relative to myes, than the function  ; otherwise
  . Thus, the function W assumes the values from 1, indicating the highest probability to belong to the class Yes, to –
![]() . The threshold W value is, as usual, 0.
. The threshold W value is, as usual, 0.
2.5. Perceptron algorithm
Perceptron algorithm is a tool for determination of the linear discriminating function through iterations. The essence of the algorithm is the following. Vectors from both sets are successively produced; if a vector is classified correctly (W>0 for the class Yes and W<0 for the class No), the next vector is produced; if the classification is incorrect, the incorrectly classified vector is either added to (for positive set) or deducted from (for negative set) the discriminating function.
![]()


(6)
If the sets are linearly separable, the algorithm converges over a finite number of iterations. We applied the perceptron algorithm to discriminate between the sets in a 20-dimensional space (analogous to the space used for the linear Fisher discriminant) and a space of L<= 20 dimensionality, where L is the sequence length. In the latter case, the vector of 0 and 1 corresponded to each sequence, where 20 components corresponded to each position: 19 zeros and one unity in case of the corresponding residue. Here, the calculation of the discriminating function value coincided formally with the weight matrix method (at W0=0), but the weight function can assume any values. The threshold W value was, as usual, 0.
3. Results
To test the system of the programs developed, we used the sequences of the most abundant class of functional motifs, C2H2 zinc-finger motif. They have the following general form: С-х(2)-С-х(12)-Н-х(3)-Н. The set was extracted form the SwissProt database and contained about 960 sequences. To form the positive training set, 100 sequences were extracted from the initial set; in addition, sets containing 50 sequences were formed to test the programs generated. The negative set was of the same value (100 sequences) and contained the sequences of random amino acid residues. Similar 50-sequence sets were used for testing the programs. The results obtained are shown in table and figure.
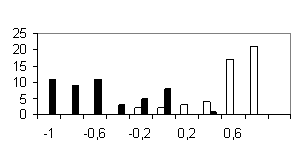
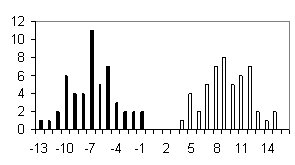
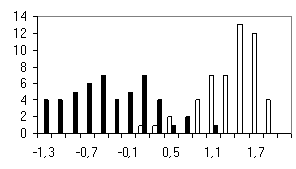
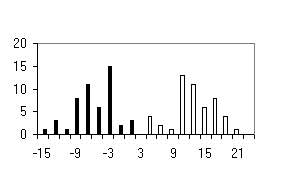
Shown in the histograms (Figure) are the numbers of test examples depending on the corresponding values of the weight function. Note that all the methods give satisfactory results; however, they are essentially different. A low type I error is typical of the perceptron method; however, the sizes of the training sets used were insufficient to avoid the type II error in the 20-dimensional space of properties. Occurrence of the type II errors in application of the consensus method is connected with a poor selection of the threshold. As is evident from Table and Figure, the two sets were separated completely, as in case of weight matrix and perceptron application.
Table. Results of the testing of the programs generated in independent control data
|
Consensus building |
Weight matrix |
Linear Fisher discriminant |
Perceptron algorithm based on the relative frequencies of amino acid residues |
Perceptron algorithm |
|
| Type I error |
0 |
0 |
2 |
0 |
0 |
| Type II error |
3 |
0 |
3 |
17 |
0 |
| Maximal value for positive set |
21 |
4.965 |
0.959 |
2.0 |
15 |
| Minimal value for positive set |
5 |
1.190 |
-0.040 |
0.052 |
5 |
| Maximal value for negative set |
1 |
-1.585 |
0.318 |
1.116 |
-1 |
| Minimal value for negative set |
-15 |
-4.236 |
-1.645 |
-1.995 |
-13 |
Type I error is the number of negative examples erroneously recognized as positive examples; type II error, positive test examples erroneously ascribed to negative examples. Each test employed 50 positive and 50 negative sequences.
Thus, the system developed provides the possibility to select a most appropriate recognition method for a given site or, at least, allows the user to select such method. However, as it is impossible to predict the efficiency of a given method in recognition of a given site, application of all the methods with subsequent averaging of the results obtained is suggested as a next step. Such averaging could increase the recognition accuracy.
This work was supported by grants from the Russian Foundation for Basic Research (No.97-04-49740, 97-07-90309, 96-04-50006, 98-04-49479, 98-07-90126); Russian Ministry of Science and Technologies; Russian Human Genome Project; Russian Ministry of High Education; Siberian Department of RAS (Programms for support of reseach of young scientists and Programm of Integration projects); National Institutes of Health, U.S.A. (No.5-R01-RR-04026-08)
References
- M.S. Gelfand , Journal of Computational Biology, 2, 1,87-115 (1995)
- Hirst S.D., Sternberg M.S.E. Biochemistry, 31, 7211-7219 (1992)
- Thomas D. Schneider, Gary D. Stormo, Larry Gold, Andrzej Ehrenfeucht, Journ Mol Biol, 188, 415-431 (1986)
- Peter D. Papp, Dhruba K. Chattoraj, Thomas D. Schneider J Mol Biol 233, 219-230 (1993)
- Thomas D. Schneider , R. Michael Stephens Nucleic Acids Research, 18, 20, 6097-6100.
- Thomas D. Schneider, Gary D. Stormo, Nucleic Acids Research, 17, 2, 659-674. (1989)
- Nathan D. Herman, Thomas D. Schneider, Journ Bacteriol, 174, 11, 3558-3560. (1992)
- N.N. Alexandrov , A.A. Mironov, Molekularnaya Biologiya, 21, 1, 242-249 (1987) ( in russ.)
- Thomas D. Schneider, Gary D. Stormo, Larry Gold, Andrzej Ehrenfeucht Nucleic Acids Research, 10, 9, 2997-3011. (1982)
- Berg O.G., von Hippel P.H. Trends Biochem Science, 13, 207-211 (er 301) (1988)
- Richard O Duda ,Peter E. Hart Pattern classification and scene analysis. A Wiley-Interscience Publication John Wiley and sons 1973 (Распознавание образов и анализ сцен, Мир Москва 1976)
a) Weight matrix |
b) Linear Fisher discriminant  |
c) Perceptron |
d) Perceptron without considering the positions |
e) Consensus |
Figure. Histograms of test sequence distributions over the weight function values: black, negative examples (random sequences); white, positive examples (zinc-finger motif). |
